1 year ago we launched HVP Risk Dashboard to provide our clients and the investing public with our broad thoughts on markets and to share updated views in between our quarterly investor letters. Along the way we’ve shared charts, graphs, stats, video interviews, a podcast, our 10 Surprises, and Field Notes from trips to investor events for some of the firm’s holdings. We are grateful to each of our readers and we hope you enjoy the updates! After two special editions where amidst the tariff induced selloff in April we used a video interview our Christopher P. Davis did to have a “Risk Dashboard in Action”and May’s momentous Field Notes for Berkshire-Hathaway & Markel , we return to our usual chartbook and commentary format. The times, however, remain anything but normal.
WSJ front page for the weekend of June 14, 2025
We write with just over 2 weeks before the end of the 90 day pause on the Trump administration’s reciprocal tariffs is set to expire. The details on any finalized trade deals between the US and counterparties have yet to emerge. In April, before this 90 day pause, equity markets moved swiftly to price a “worst-case” outcome for global trade and the US economy. Since that pause was put in place, markets have begun to price what feels like a “best-case” outcome - a permanent pause on anything that matters. Invariably, reality will fall somewhere between the worst and best cases, which has led us to temper our enthusiasm for this rally on tariff grounds. On the matter of the budget deficit and federal debt, we are actually a bit more optimistic than in the past. While the mechanics of it are too involved for this short note, we see a scenario in which the path of US Treasury debt refunding and debt issuance, coupled with at least arms-length central bank coordination, could lead to lower rates, lower debt expense, and an improved path. There are a few different decision trees that can get you there, but a few of the paths do end up with something that is long-term bullish for assets, especially those that can grow their cash flows over time. If some of those early steps continue to progress, the market may quickly sniff them out. But that’s a long term matter.
In the short term, we expect heightened volatility for the rest of the summer. Between now and July 9th, there are a scant 13 US trading days due to the Juneteenth and July 4th holidays. Throw in many risk takers taking time off and markets can easily get jumpy. That all was the case before the simmering conflict between Israel and Iran & its proxies boiled over on the evening of June 12th. Markets had largely shrugged off the tensions in the Middle East since the October 7, 2023 Hamas attacks on Gaza. At this point, it is only fair to consider it an active war zone with nuclear ramifications. As investors, we do not see too many immediate off-ramps, which means this risk will be with us for awhile.
One of the best advantages an investor can have is time. We are fortunate at HVP to have a loyal and patient investor base which gives us the freedom to treat short-term disruptions as long term opportunities. The next few weeks look to be incredibly headline driven.
Themes to Takeaway
Bullish Themes
IPOs have performed well in early trading and SPAC issuance has stepped up significantly - both point to “risk-on” investor sentiment.
Inflation in government statistics has not (yet) moved higher due to trade policies. It is still a stretch to call the labor market weak.
Q1 Earnings Results were strong throughout most sectors, notably technology and AI related firms. The massive amount of AI investment by corporations appears to be undeterred by recent events.
Bearish Themes
The suspended animation of the tariff pause is nearly over without major deals signed.
There is open conflict between middle-eastern nations.
The “Big-Beautiful Bill” is yet to be passed and has debatable impacts on the long term budget deficit.
Keep your eye on
Do a flurry of trade deals emerge?
Does an off-ramp for the Israeli/Iranian war appear?
U6 Unemployment calculated in the pre-1994 adjustment method:
27.50%
(John Williams’ Shadow Government Statistics April 2025)
Tech Sector Layoffs:
2025: 62,832 employees /141 companies
2024: 152,074 employees/546 companies
2023: 263,180 employees/1,191 companies
2022: 166,269 employees/1,064 companies
Federal Sector Departures & “DOGE” Cuts:
Total YTD Federal Departures: 171,843
…of which DOGE Layoffs are: 61,296
(layoffs.fyi as of 6/14/2025)
Global Central Bank Postures
As of 6/15/25. Big week ahead for Central Banking!
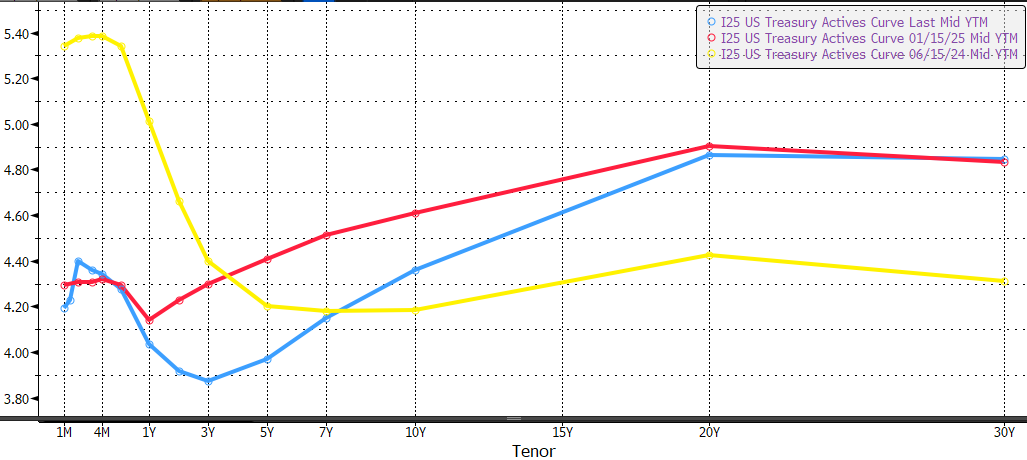
The Movement of the US Treasury Yield Curve
Blue = Current; Red = 6 months ago; Yellow =1 Year Ago
Net % of Banks Tightening Lending Standards for C&I Loans
Via FRED. A notable shift higher for the Q2 observation. As of 5/12/2025.
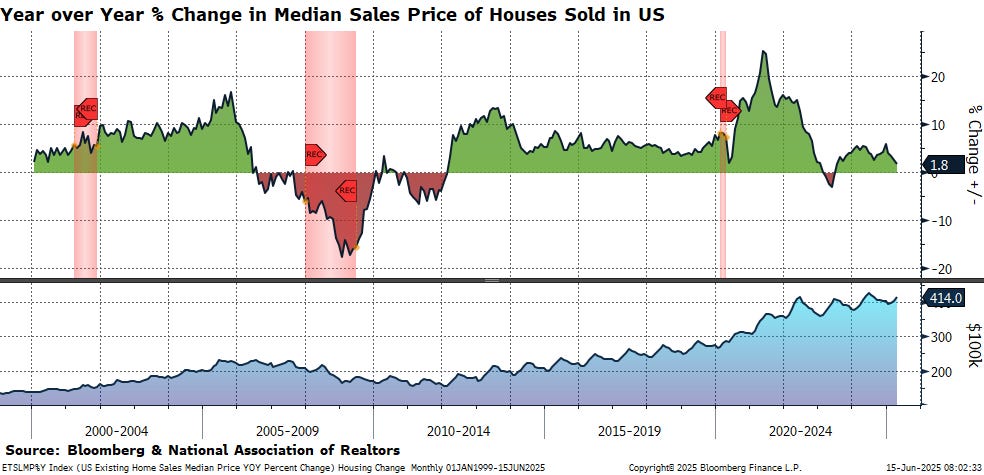
Looking at Housing
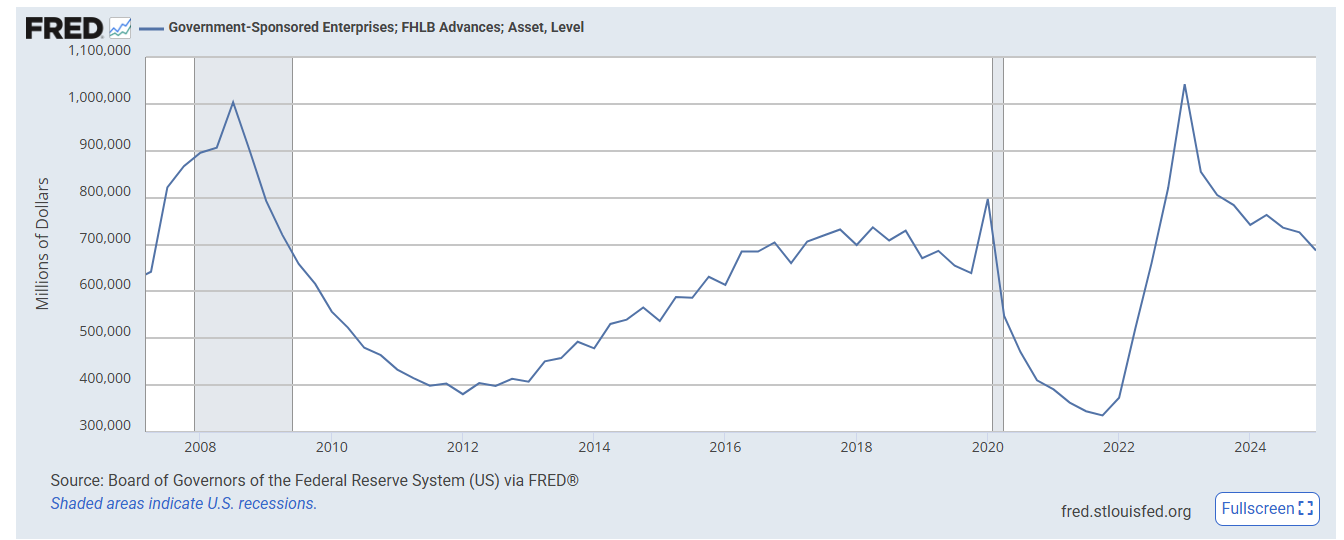
Canary in the Coal Mine: FHLB Borrowings
Via FRED. As of June 12, 2025. Shaded periods indicate recessions.
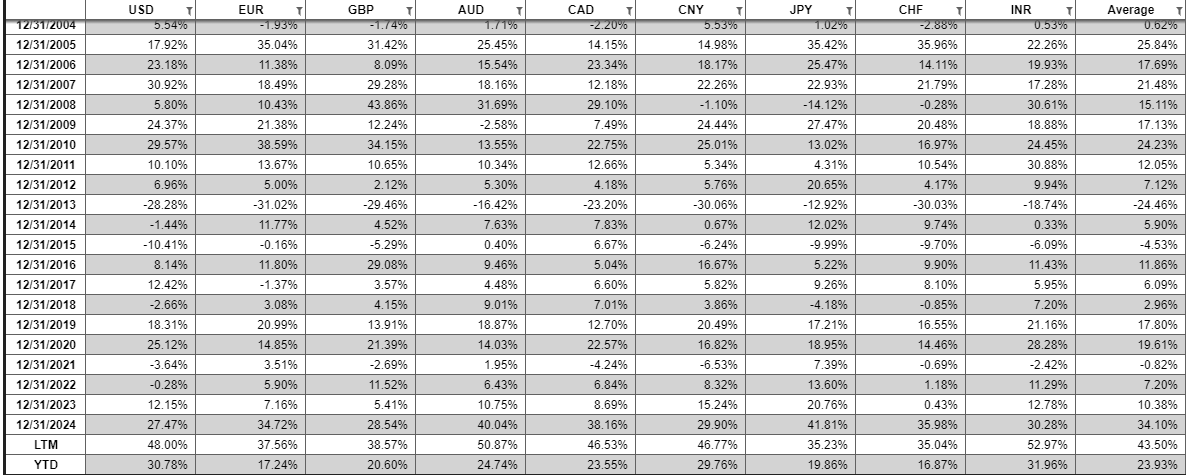
Performance of Gold in Major Currencies - % Change
Click to enlarge. As calculated by HVP. Raw Data via Bloomberg as 6/15/2025. Barbarous relic or low-cost absolute return alternative?
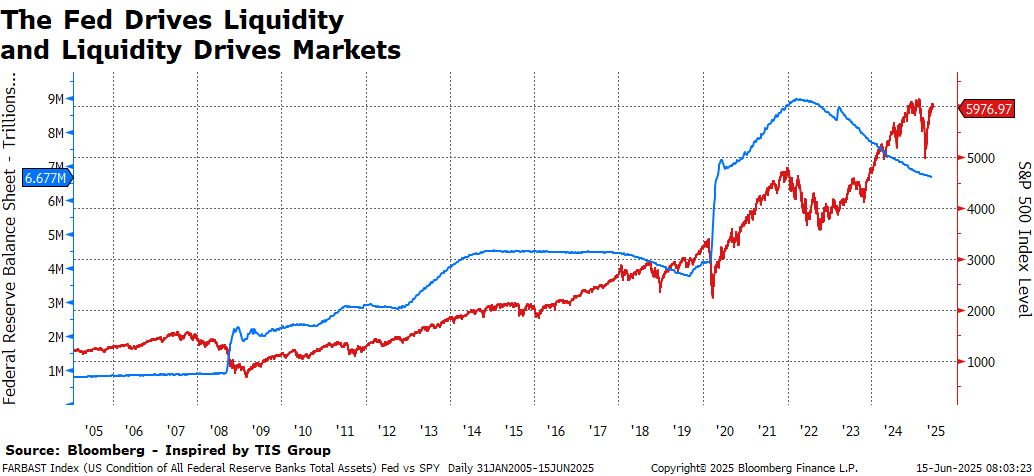
Broad Market Levels
Red & Right Scale, S&P 500 Index. Blue & Left Scale Fed Balance Sheet. Via Bloomberg as 6/15/2025.
Top Panel/Blue = SPY; Middle Panel/Green = HYG; Bottom Panel/Red = CMBS. As of close on 6/13/2025.
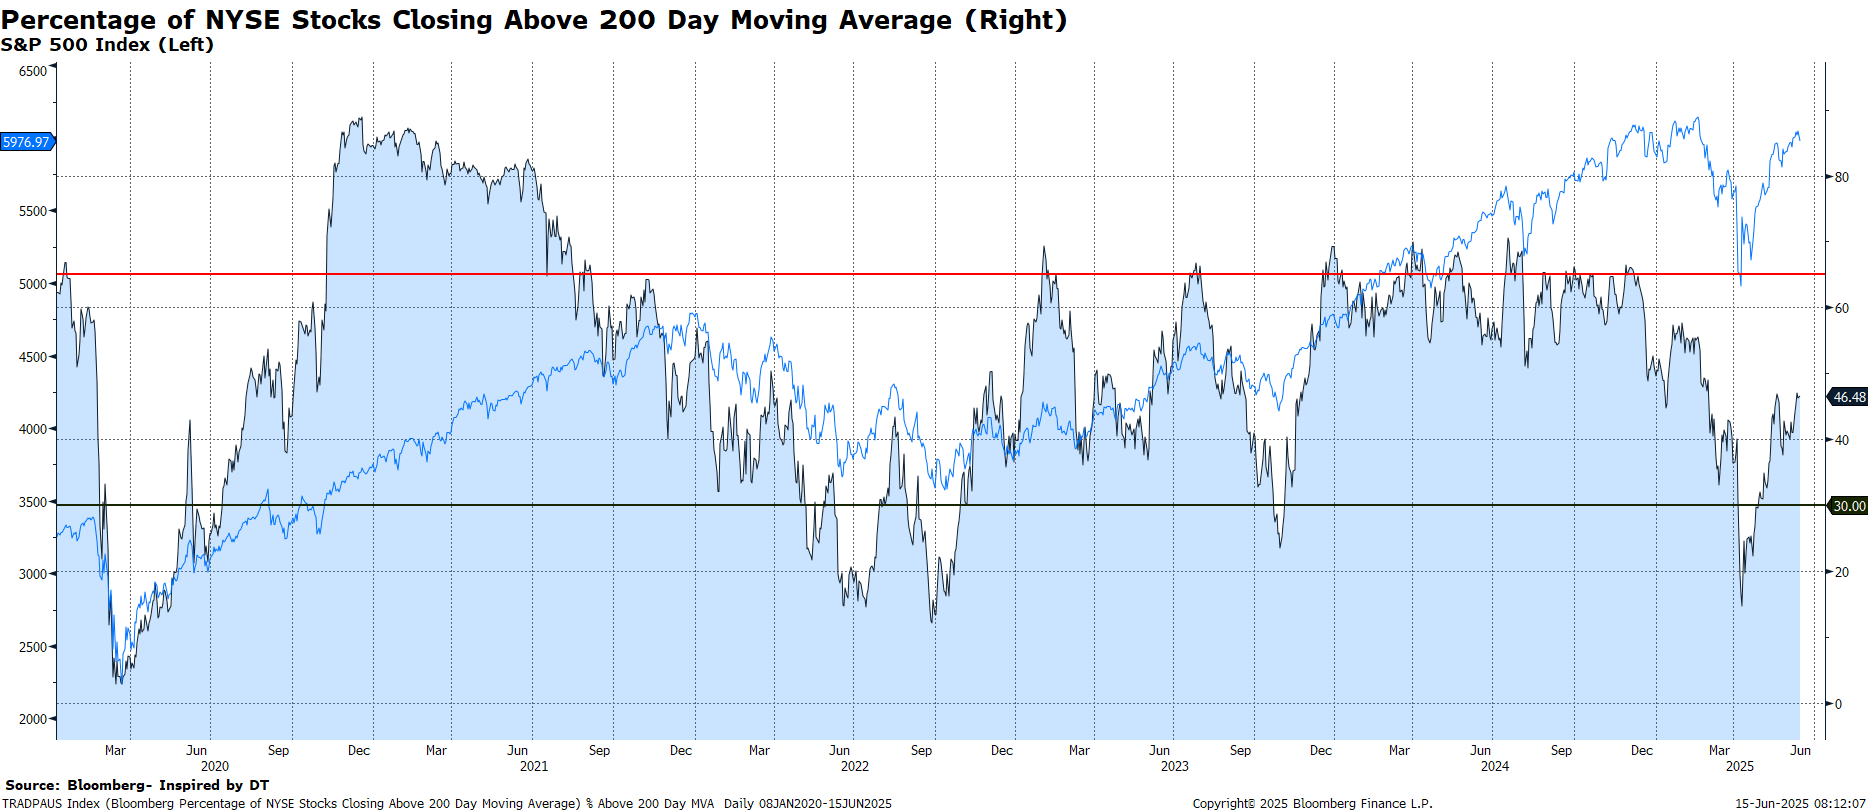
Moving Averages
S&P 500
S&P 500 Index 1 Year trailing, with moving averages and RSI. Chart via Bloomberg as of close 06/13/2025.
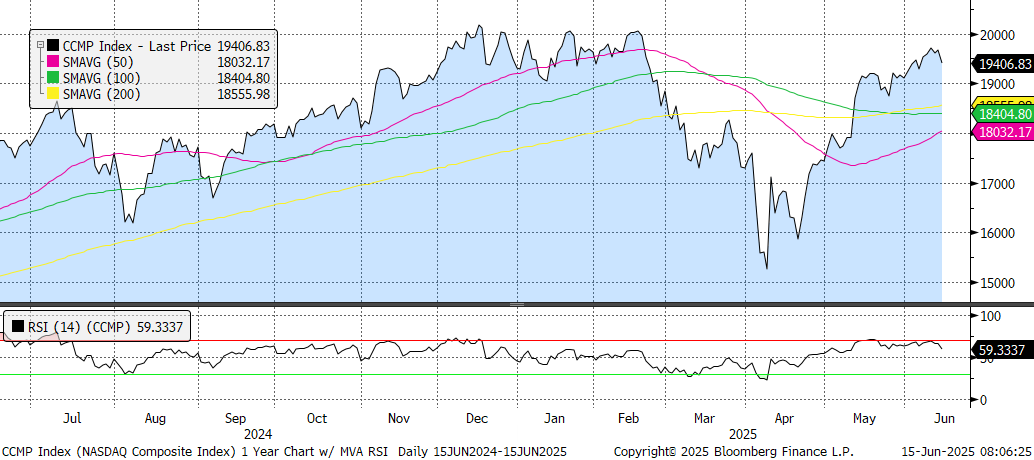
Nasdaq
NASDAQ Composite Index 1 Year trailing, with moving averages and RSI. Chart via Bloomberg as of close 06/13/2025.
Dow Jones Industrial Average
Dow Jones Industrial Average 1 Year trailing, with moving averages and RSI. Chart via Bloomberg as of close 06/13/2025.
Berkshire Watch
A measure of reasonableness, staring to look more reasonable. 6/13/2025
(Charts as of 6/13/25)
A Look at the S&P 500 Sectors:
As calculated by HVP Research. S&P 500 ETF, Gold ETF, and T-Bill ETF bolded as reference levels. As of 6/13/2025.
A look around the (multipolar) world:
As calculated by HVP Research. S&P 500 ETF, Gold ETF, and T-Bill ETF bolded as reference levels. As of 6/13/2025.
Seasonality
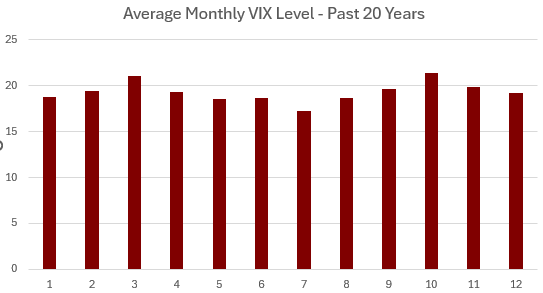
Average Daily S&P 500 Index Returns over the Past 20 Years:
HV Principle: Be cognizant of seasonality, but not a slave to it. Raw data via Bloomberg, as calculated by HVP Research. As of 6/15/2025.
Average June Level for the VIX is 18.66. Raw Data via Bloomberg. As calculated by HVP Research. As of 6/25/2025.
1-Year Trailing Chart of the VIX with RSI
Current VIX Level as of close on 6/13/25: 20.82. Chart via Bloomberg.
Sentiment & Technical Indicators
Insider Buying & Selling
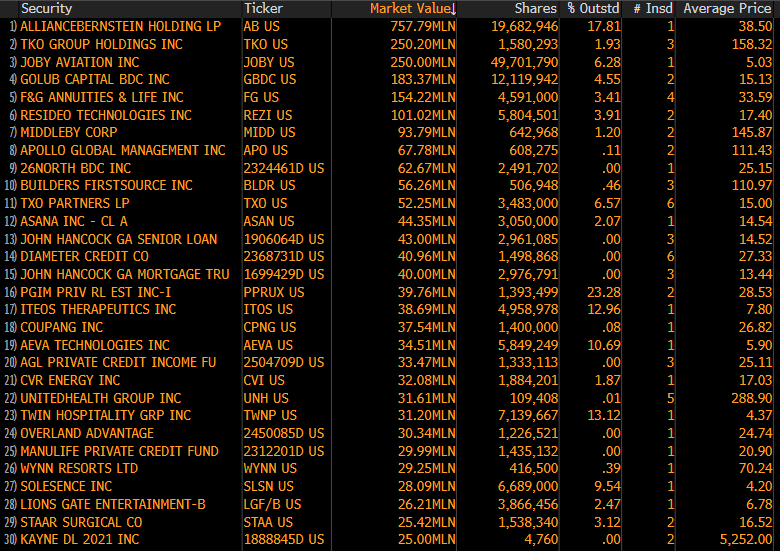
Top Buys in the Last 3 Months (as of 06/15/25 via Bloomberg)
Top Sells in the Last 3 Months (as of 06/15/25 via Bloomberg)
CNN Fear & Greed Indicator
Via CNN. As of 6/14/2025.
Click to enlarge. as of 6/13/25. Chart via Bloomberg.
That’s all for this edition - see you next month for more charts!
And later next week for a Special Field Notes Edition - HVP is on the road 6/18!
Notes:
We are pleased to share a monthly version of our internal Risk Dashboard with our clients and subscribers from the investing public at large. A few reminders:
The HVP Risk Dashboard is not an equity or credit research product and not a specific recommendation to make any investment decisions.
Data is generally presented here without comment.
HVP and affiliates may have positions in or against any securities referenced.
This is a chart heavy report. Clicking or tapping a chart will open it in a new window. While we all live on our phones, the best viewing will probably be on a larger screen such as your iPad, laptop, or desktop.
The Risk Dashboard is complimentary for HVP clients, institutional partners, and members of the investing public we hope decide to become clients!