

April 2025
Markets on the Agitate Cycle
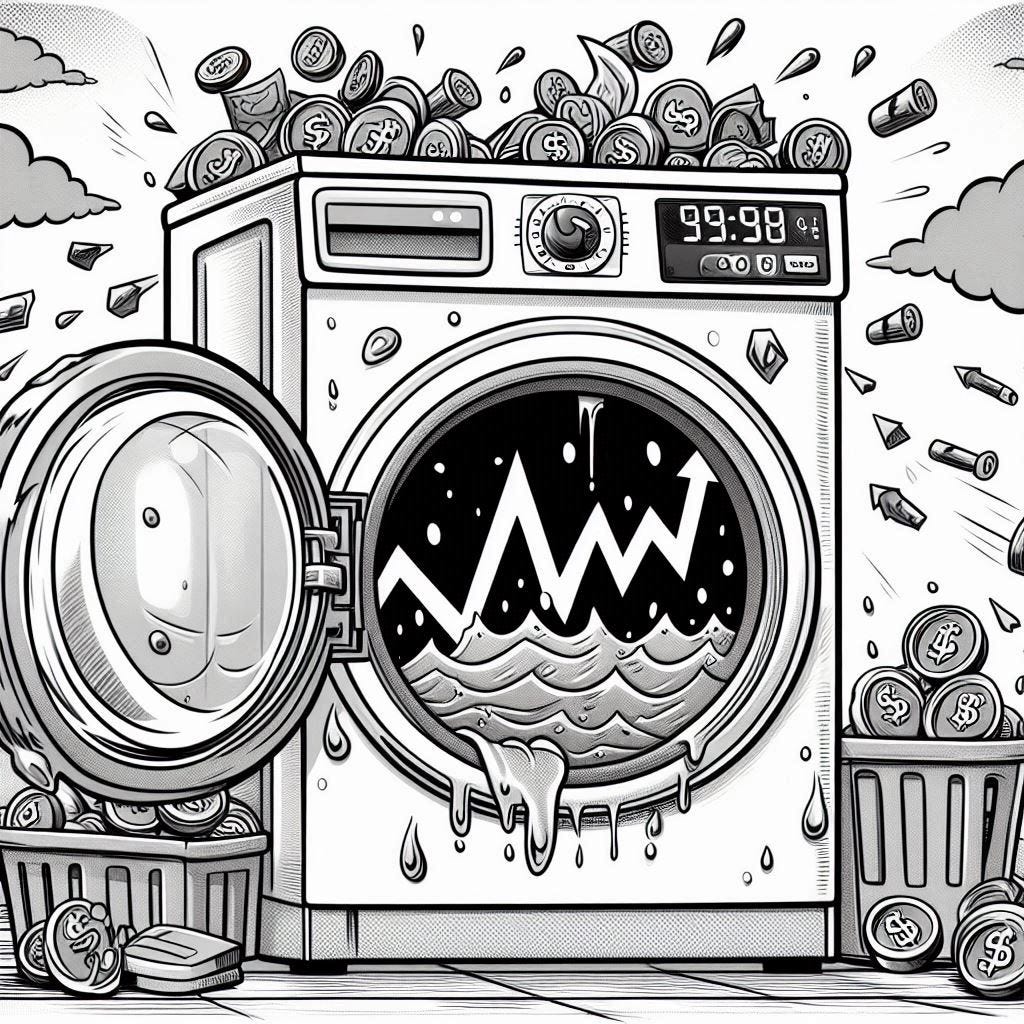
Politicians have the spin cycle after the news comes out. For investors, right now we are in what we call the “agitate” cycle - left/right up/down as the latest news and information gets digested by markets. We worked to get our quarterly investor letters out as quickly as possible to our investment management clients given everything happening in markets. If you would like us to resend a copy of those, please contact your HVP team member as our views have not broadly changed since then.
This month we are going to take a slightly different approach, and call it a HVP Risk Dashboard - In Action. On April 7th, our Christopher Davis gave an interview after the market close on how we are making sense of and looking for opportunities during this sell-off. Our views are backed by HVP Research and in the interview, Christopher mentioned several of the indicators, charts, and factors we look at. For this edition, we will be showcasing the data points he mentioned in the interview so you can see them in action!
We recommend giving the video (6 mins) a watch first or watching it side by side with the charts.


Why this market sell-off is different (0:00 - 0:58)
Market declines can be broadly grouped into 3 types - cyclical (those driven by the business cycle), systemic (think 2008 Financial Crisis), or shock driven (COVID).
Tariffs so far have created a shock driven sell-off. These sell-offs may turn into cyclical downturns, but they do not have to.
We find works by Howard Marks (Mastering the Market Cycle (2018)) and Peter Oppenheimer (The Long Good Bye (2020) and Any Happy Returns (2024)) to be instructive when thinking about market cycles.
Manner in which this can be resolved…Can markets move higher? (0:59 - 2:45)
Removal of uncertainty will be a positive for markets.
50 Countries (now over 75) looking for trade deals directly with the US.
Markets want to see off-ramps; to see a template for trade deals and how things are resolved.
A trade deal with China will be the toughest, but that is the part this probably the least surprising to investors.
Friday April 4th, on news that Vietnam was seeking to negotiate a deal, companies exposed to manufacturing there rallied sharply.
Monday April 7th, what on that day was fake news about a 90 day pause on reciprocal tariffs sent stocks higher temporarily.
It is clear that markets were willing to higher on good news (a healthy sign) as they did when subsequent to the interview on April 9th, a true 90 day pause was announced around 1:30pm EST.

Bottoms are a Process - Indicators to Watch (2:46 - 3:40)
Click/Tap to Enlarge Each Chart
It’s devilishly hard to call a bottom no matter how many indicators or charts you have.
No chart or indicator is infallible.
But we use our Risk Dashboard to have a constellation of indicators and factors to be able to challenge and test our views as we seek to develop confidence.
Stocks Closing Above their 200 Day Moving Average (5 Year Chart)

NYSE Stocks Making New Lows (5 Year Chart)

Economic Policy Uncertainty Index

Year to Date 2025 US Stock Trading Volume (billions of shares)


Looking for Opportunities (3:41 - 4:30)
Bloomberg “Mag 7” Index (Blue Mountain) vs S&P 500 Index (top green line)

The rate of change has been dramatic in markets. While the broad market level is still expensive, there are many stocks across sectors that have become cheaper than the overall market average itself.
Change in Regime = Change in Market Leadership (4:31 - 6:13)
The change from a bull to bear market regime typically brings about a change in market leadership. This does not occur immediately however.
The present policy changes which seek to reorder the global trading environment mean that it will take time for winners and losers to shake out.
It is time to start looking at businesses, especially those high quality businesses that are often more expensive stocks and start asking the question, What do you want to own when the market turns? What do you want your portfolio to look like in 3-5 years?
Changes in leadership mean investors should be looking beyond technology and be selective within technology too - there are real differences between hardware, software, cloud, and advertising driven businesses.
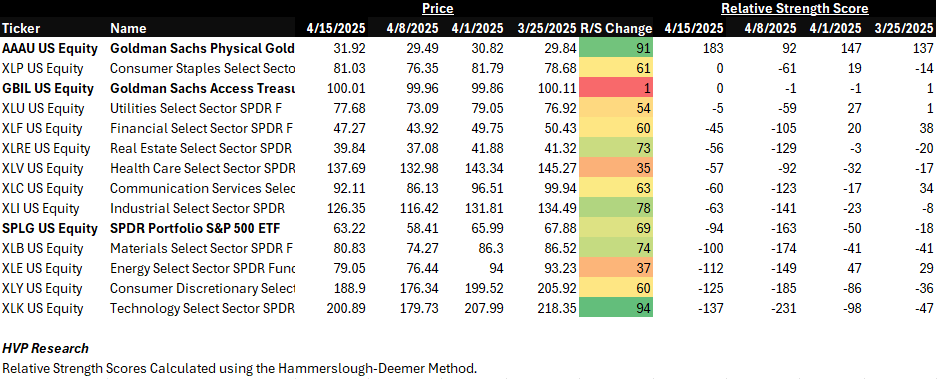
We look at relative strength measures to see which areas of the global market are rising to the top and which might be so un-loved that they demand a look too. The tables below don’t necessarily drive us to buy up an entire sector or country, but rather help to guide us to corners of the market to do further fundamental work on.
A look at Relative Strength in Broad S&P 500 Sectors:
Click/tap to enlarge
A look at Relative Strength Around the World:
Click/tap to enlarge

Looking Forward…
Themes to Takeaway from Mid-April 2025
Bullish Themes
Trade negotiations are underway.
Market uncertainty and volatility can create opportunities.
Shock driven sell-offs and bear markets have the potential to be resolved more readily than those of a cyclical or structural nature.
Bearish Themes
Consumer and business sentiment indicators have weakened, even more so along political party lines. That can create a negative feedback loop of less spending, layoffs, higher unemployment, further declines in spending….
Uncertainty will lead to lower earnings forecasts from many firms and downward revisions, if not outright guidance pulls. Stock prices are lower, but their earnings are in question. We know the P in P/E Ratios, but it is the E that is in doubt.
Bond and foreign exchange markets have by some measures displayed even more volatility than stocks, which can be a warning sign.
Keep your eye on
How the market reacts to the first trade deal being announced - whenever that is and with whatever country it happens to be.
If any shortages of goods begin to emerge on store shelves.
United Airlines (UAL) rather interestingly offered 2 versions of their guidance - recessionary and non-recessionary. That’s rather unusual and may start at a trend of companies doing so. It points to how exogenous the tariff shock really is.
We must have missed…
When “tariff” became a verb as well as a noun…
e.g. “We will tariff them…”

If you haven’t already….
Coming Soon…
Look for a special edition of the Risk Dashboard in early May, with our takes fresh from Omaha at the Berkshire-Hathaway annual meeting!