Human nature tends to take a good idea too far – on Wall Street if one is good, ten must be better. Like our little friend above on a hot summer day, when the ice cream begins to melt, things can come tumbling down in a hurry. Though we do not treat day to day volatility – the normal gyrations of Mr. Market – as risk at Hudson Value Partners, July was something different. The memory, AI, and related infrastructure boom that has been gathering steam for a few years experienced a global correction. It was hard to wrestle with on a day-to-day basis as for much of the month, earnings season had not even begun. As fundamental investors, we were in an information vacuum. Yet in the absence of any meaningful news, South Korea’s memory maker dominated index, the Kospi took a wild ride, and in the US, the NASDAQ index of primarily tech stocks was thrown for its own loop. At first, it seemed it may have been profit taking after a strong run or some investors coming to their senses and remembering that the only free lunch in investing is diversification.
By the final week of July, the explanation proved surprisingly simple: leverage. South Korea’s memory stocks were being bought up by leveraged, single stock ETFs - highly risky, speculative funds that give the investor a multiple of the return of the underlying stock. They are express elevators that run both ways and can crash through the basement floor. Over 3% of the adult South Korean population faced margin calls in July.1 At the same time, US tech investors in both publicly traded ETFs and hedge funds were investing similarly. It is always difficult to pinpoint what causes things to begin to unravel, but unravel they did. It was not the fundamental earnings power of the enterprises, artificial intelligence (in and of itself) or new technologies that set markets on a wild ride, but something very old and comparatively natural: greed.
In the immortal words of the late Charlie Munger:
Smart men go broke 1 of 3 ways: ladies, liquor, or leverage.
As these ice cream towers melted (and some even toppled over) last week, markets had what we think is a healthy reset. The speculators lost their chips, and the hard dollar investors are left. This episode is a good reminder that while fundamental analysis may help find attractive companies and market volatility may create opportunities, systematic risk always remains. Put another way – if your neighbor’s house catches on fire, it may not matter how good your sprinkler system is.
The parallel event in July that also left many a commentor breathless was Federal Reserve Chairman Kevin Warsh’s second press conference. Although the discount rate was left unchanged and the chairman reiterated the commitment to bringing inflation back to the 2% target, that he stuck to his previously outlined approach of saying less than his three immediate predecessors (Powell, Yellen, Bernanke) would have, was more than many could handle. Warsh is challenging the 21st century academic wisdom that more chatter from central bankers is better. We do not think it is so much that prior Fed chairs oozed brilliance from the podium, but that they said so much that it gave the press material for days. Fed watching may simply not be as exciting as it once was. Chair Warsh wants to let the data and markets do the talking. As a team that spends a lot of time with the data on a company level and to a lesser extent on the macro level, that is fine by us.
When we spend time digging through the company-by-company data, we are gathering up the mosaic pieces that inform our views as investors. In Richemont’s Q2 sales update, they called out notable strength in South Korea, a market they generally never speak about. Evidently a few investors swapped memory stocks for a more enduring Cartier trinket. Apple quietly rolled out the ability to lease laptops, desktops, and tablets like you would a car. Despite renewed US/Canada/Mexico trade tensions, Canadian Pacific Railway – the only single network covering all 3 nations – reported year over year growth. These are just a few of the mosaic pieces we’ve been tiling together in the past month. We look for evidence that both confirms and challenges our investment theses. Often, the single piece that changes the picture is the one that reveals an entirely new opportunity.
Enjoy the rest of the summer and take it from us – one scoop of your favorite ice cream flavor is plenty!
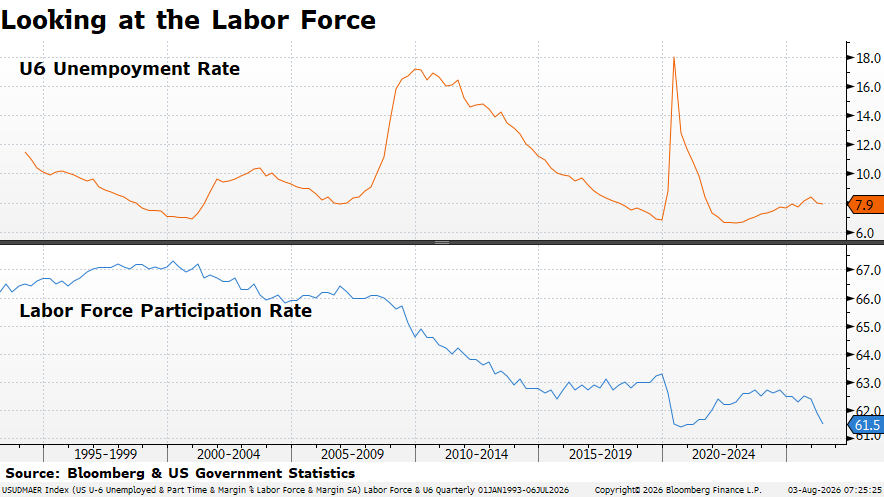
U6 is a wider measure of unemployment than the commonly cited headline number. Data most recently available via Bloomberg.
Tech Sector Layoffs:
2026: 124,682 employees / 257 companies
2025: 123,941 employees /269 companies
2024: 152,074 employees/546 companies
2023: 263,180 employees/1,191 companies
2022: 166,269 employees/1,064 companies
(layoffs.fyi as of 08/03/2026)
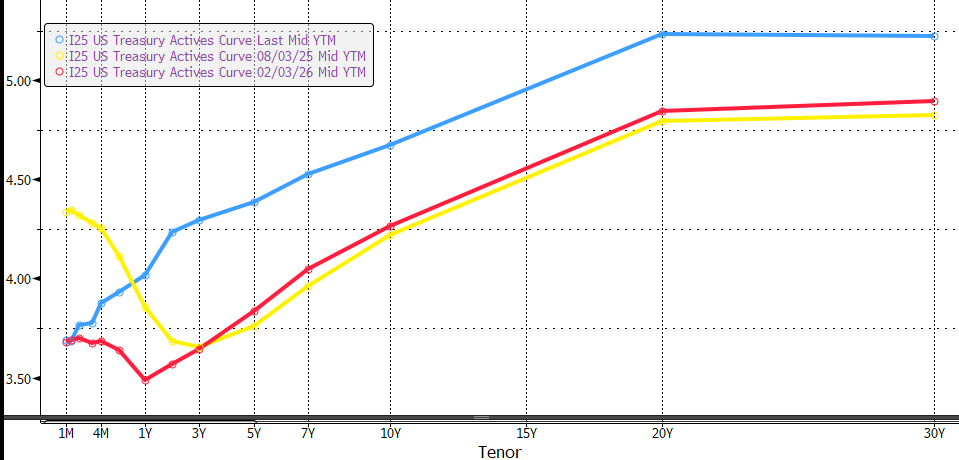
The Movement of the US Treasury Yield Curve
Blue = Current; Red = 6 months ago; Yellow =1 Year Ago
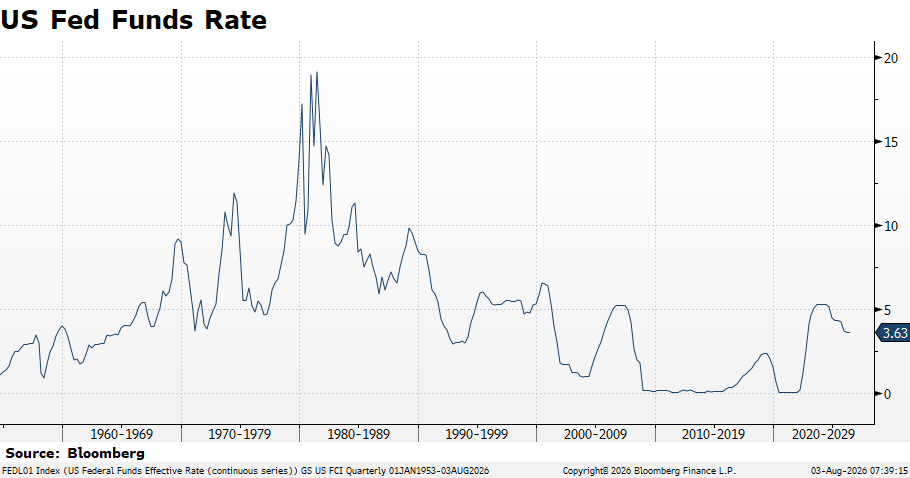
Fed Funds on a LONG time scale - 1953-present as of 8/3/2026 via Bloomberg.
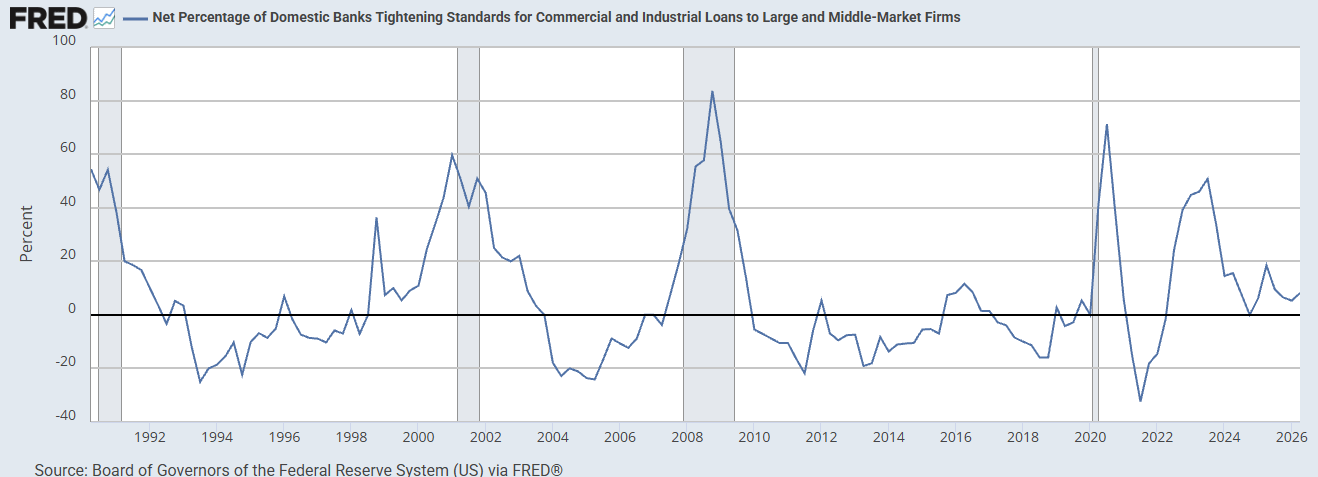
Net % of Banks Tightening Lending Standards for C&I Loans
Via FRED - Q2 Observation 8.1%.
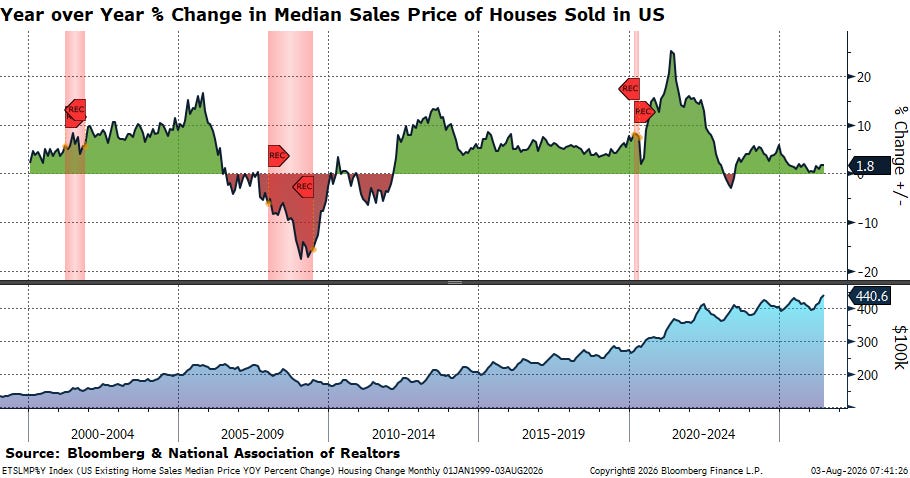
Looking at Housing
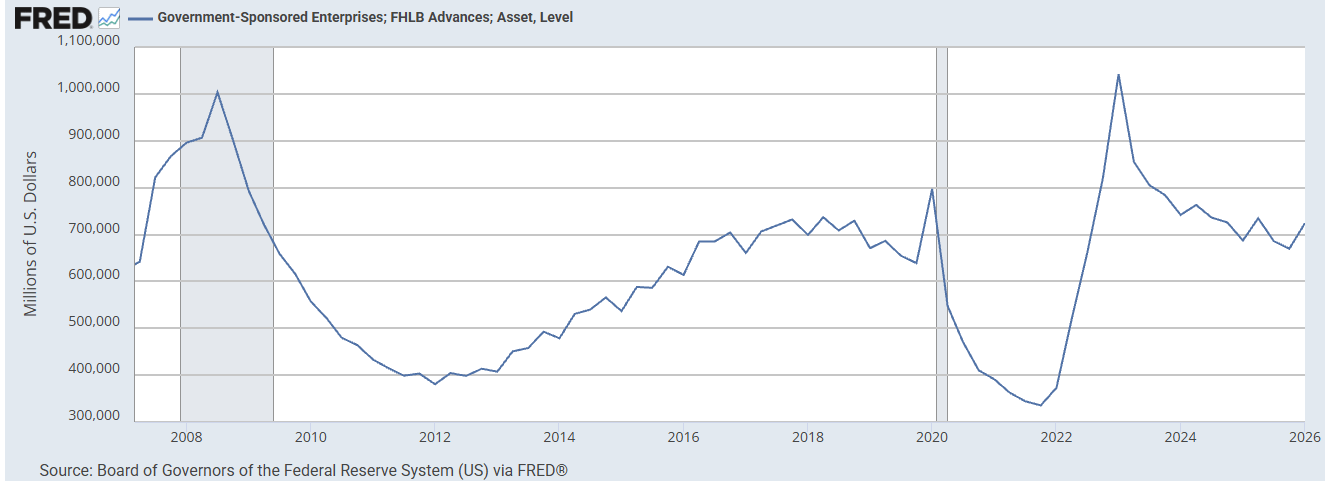
Canary in the Coal Mine: FHLB Borrowings
Via FRED and Board of Governors of the Federal Reserve System - 6/11/2026 latest reading.
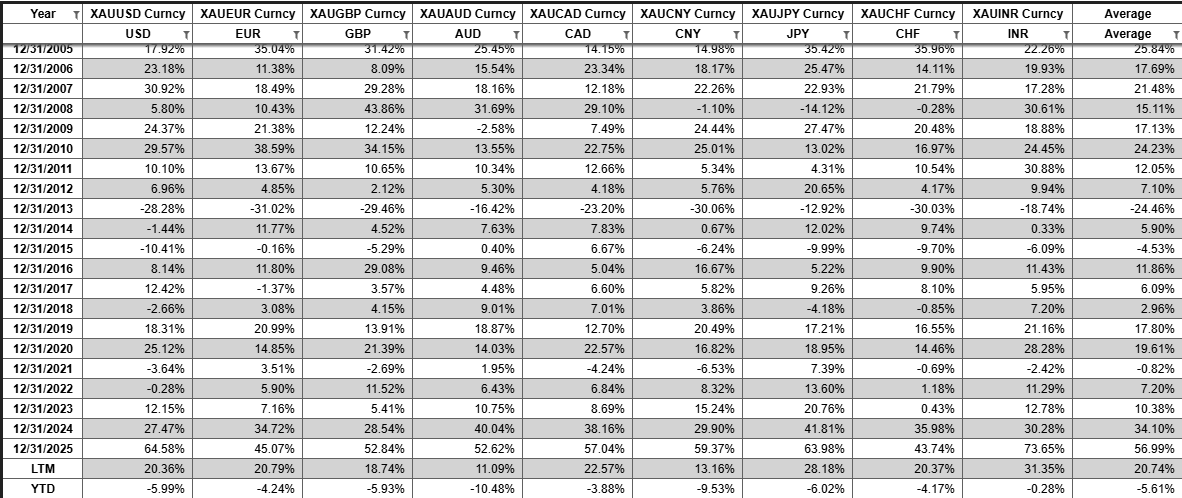
Performance of Gold in Major Currencies - % Change
As calculated by HVP Research, raw data via Bloomberg. As of 08/03/2026.
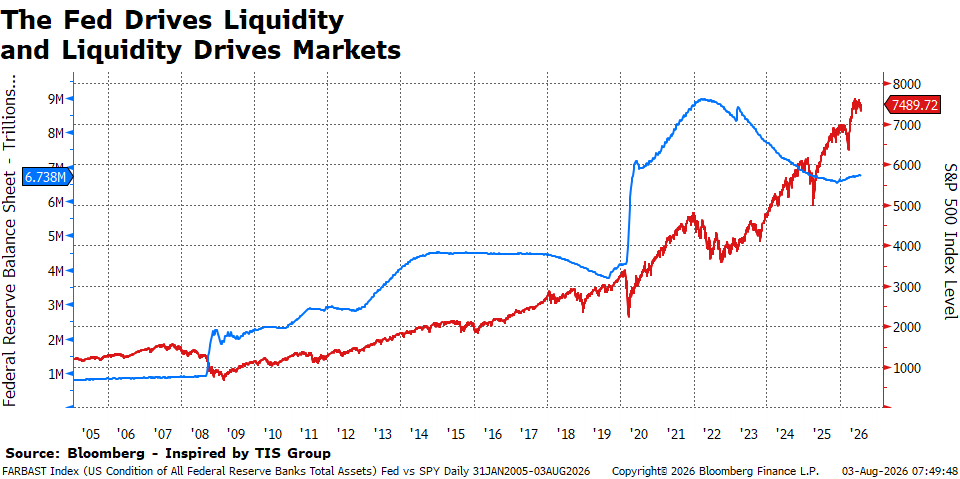
Broad Market Levels
Blue & Left Scale - Fed Balance Sheet in USD. Red & Right Scale S&P 500 Index level. Via Bloomberg as of 08/03/2026.
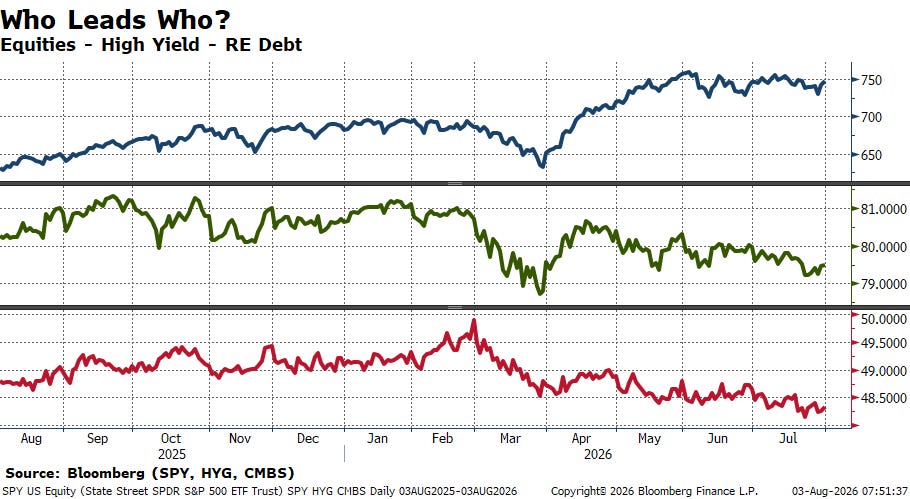
Top Panel/Blue = SPY; Middle Panel/Green = HYG; Bottom Panel/Red = CMBS. As of 08/03/2026.
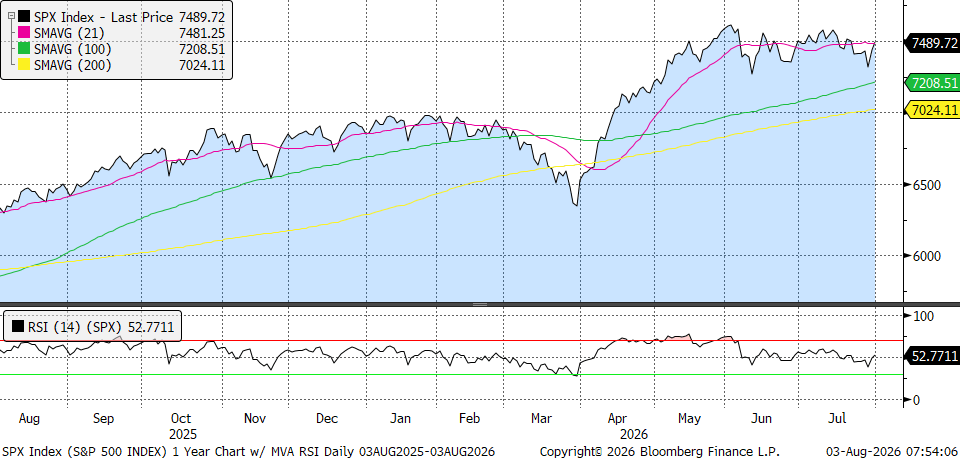
Moving Averages
S&P 500
S&P 500 Index 1 Year Trailing, with moving averages and RSI. Chart via Bloomberg as of 08/03/2026.
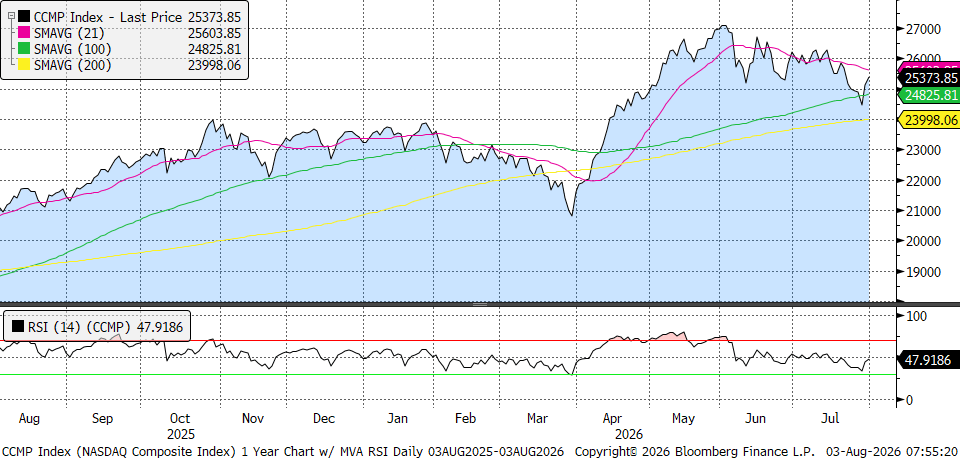
Nasdaq
NASDAQ Composite Index 1 Year Trailing, with moving averages and RSI. Chart via Bloomberg as of 08/03/2026.
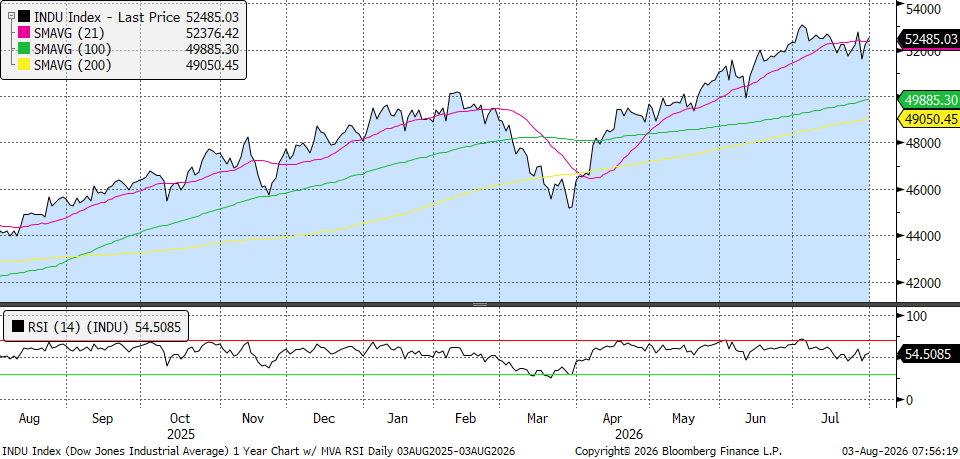
Dow Jones Industrial Average
Dow Jones Industrial Average 1 Year Trailing, with moving averages and RSI. Chart via Bloomberg as of 08/03/2026.
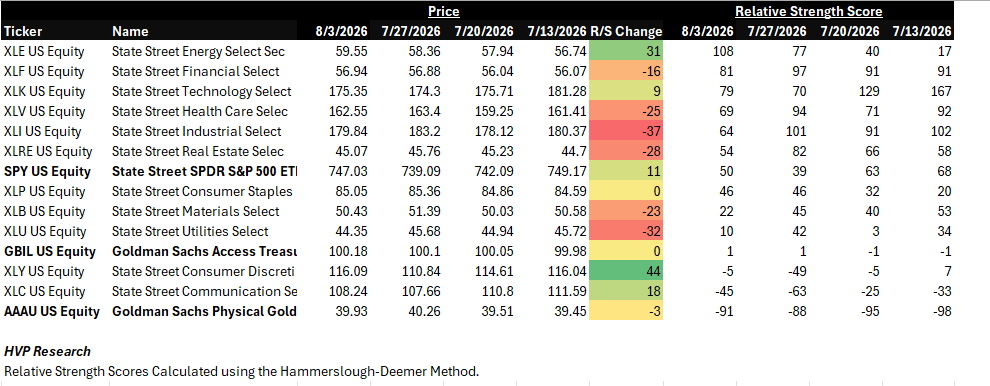
A Look at the S&P 500 Sectors:
Click to enlarge. As calculated by HVP Research. Gold, T-Bills, and S&P 500 ETF bolded as reference levels. As of 08/03/2026.
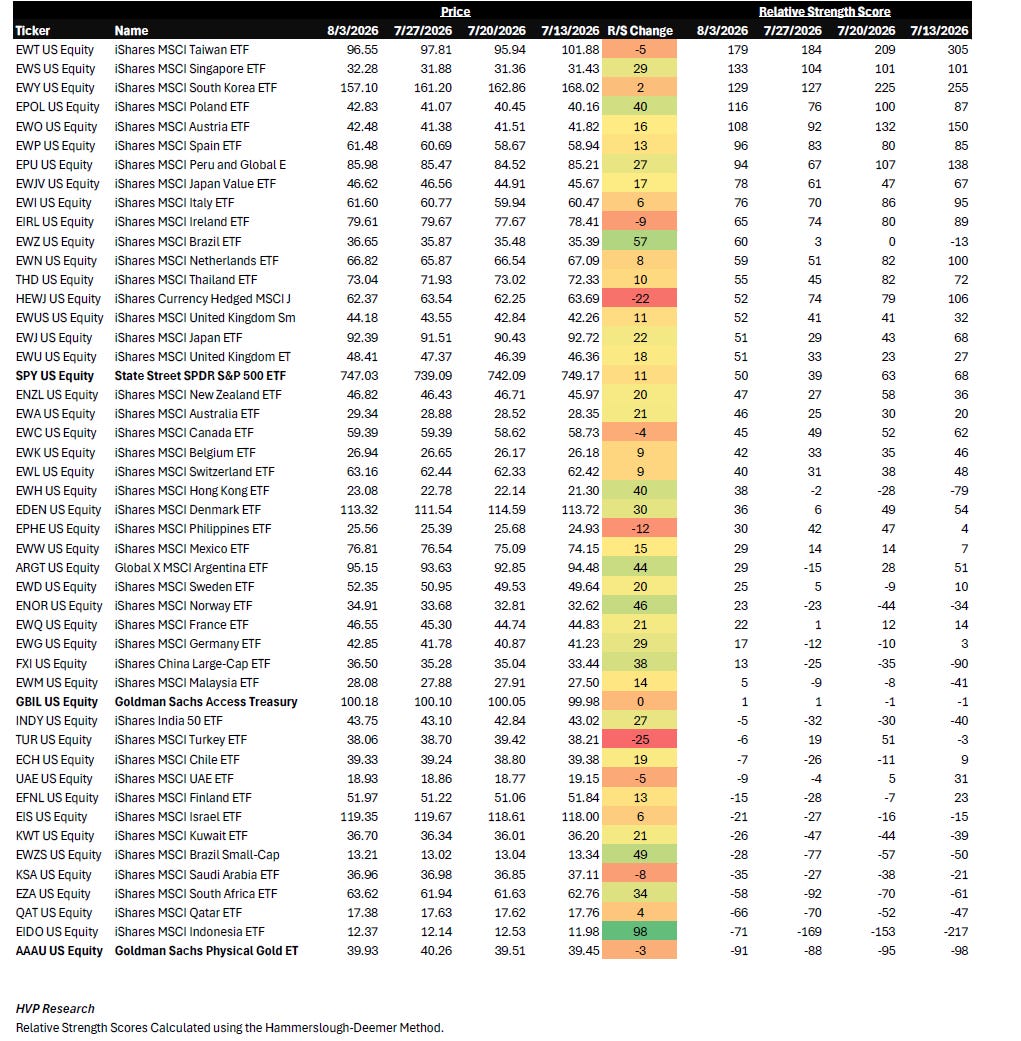
A look around the (multipolar) world:
Click to enlarge. As calculated by HVP Research. Gold, T-Bills, and S&P 500 ETF bolded as reference levels. As of 08/03/2026.
Seasonality
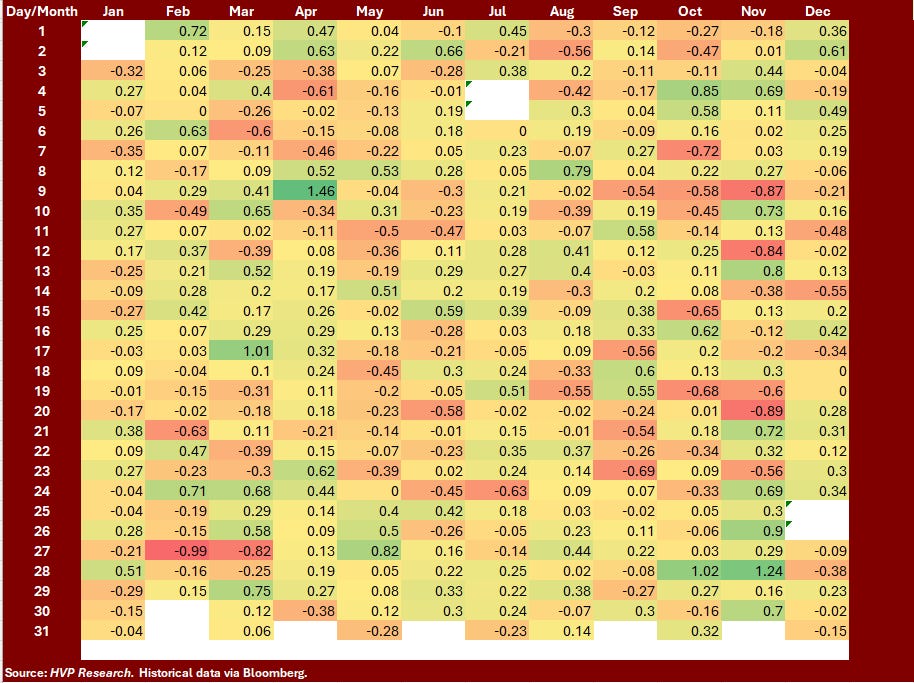
Average Daily S&P 500 Index Returns over the Past 20 Years:
20 Year Average back to 2006, raw data via Bloomberg, as calculated by HVP Research as of 08/03/2026.
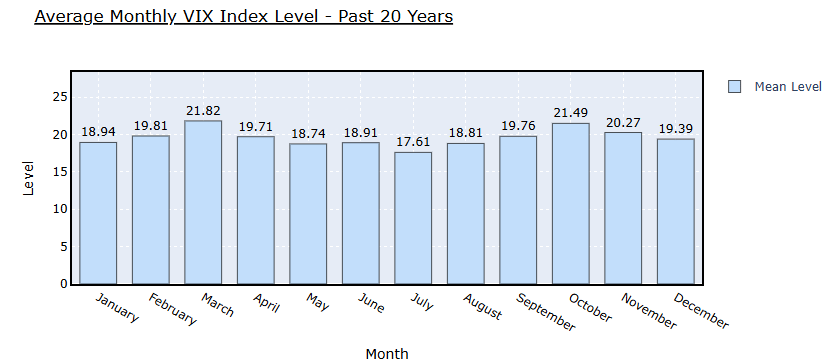
As calculated by HVP Research, raw data via Bloomberg. As of 08/03/2026.
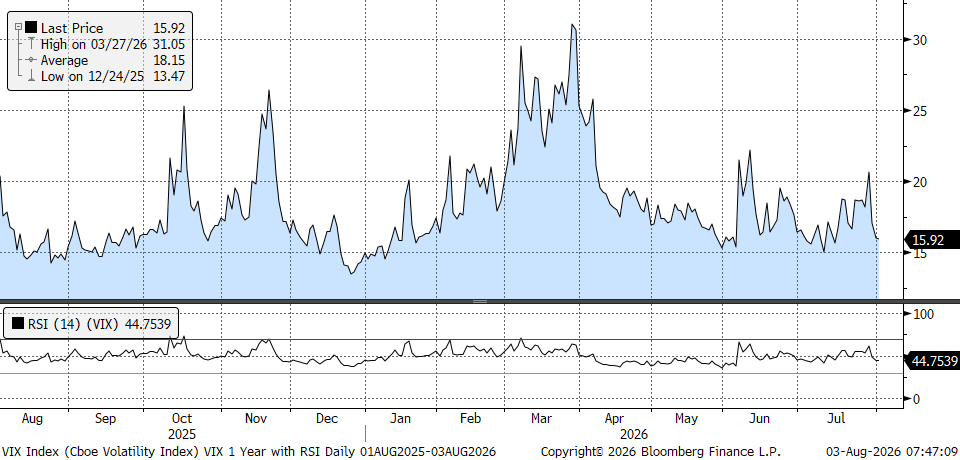
1-Year Trailing Chart of the VIX with RSI
Year Trailing Chart of the VIX with RSI. The VIX is currently 15.92. Data as of 8/3/26.
Sentiment & Technical Indicators
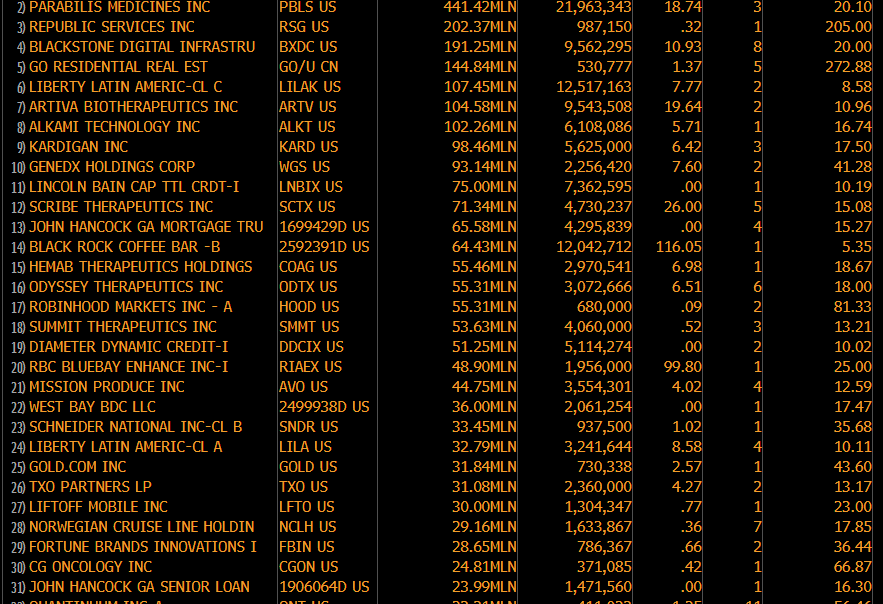
Insider Buying & Selling
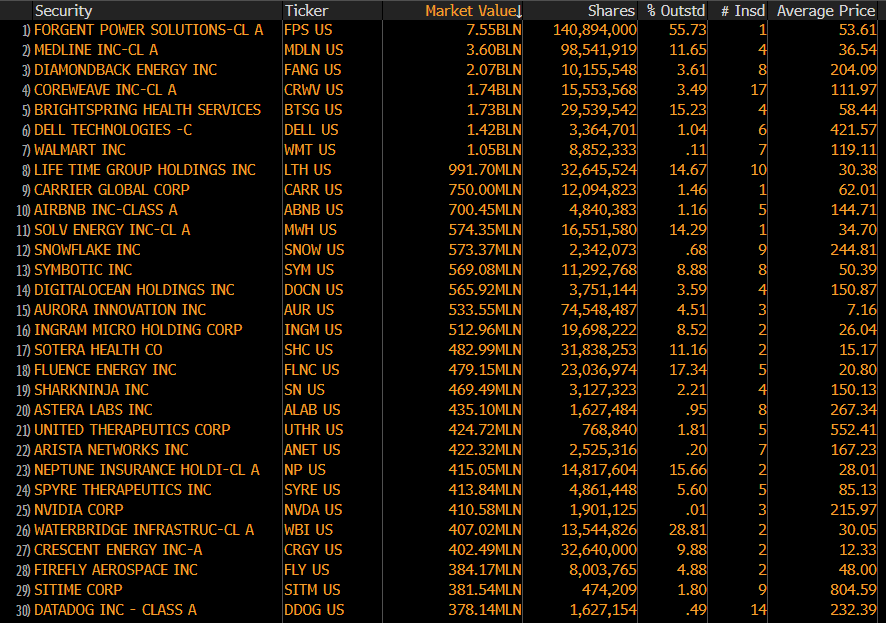
Top Buys in the Last 3 Months (as of 08/03/26 via Bloomberg)
Top Sells in the Last 3 Months (as of 8/03/26 via Bloomberg)
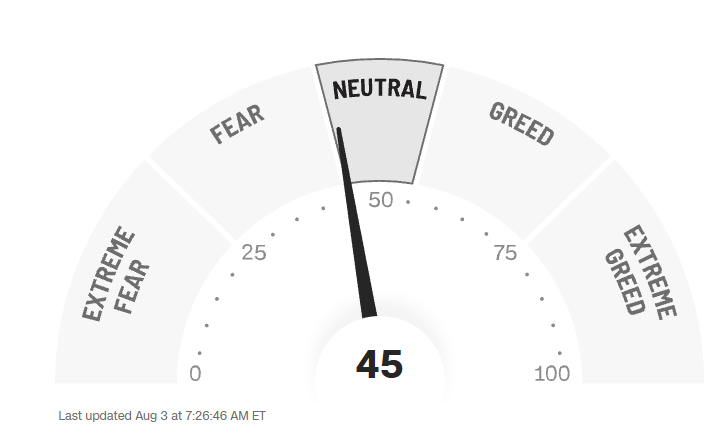
CNN Fear & Greed Indicator
CNN Fear & Greed Indicator as of 08/03/2026. https://www.cnn.com/markets/fear-and-greed
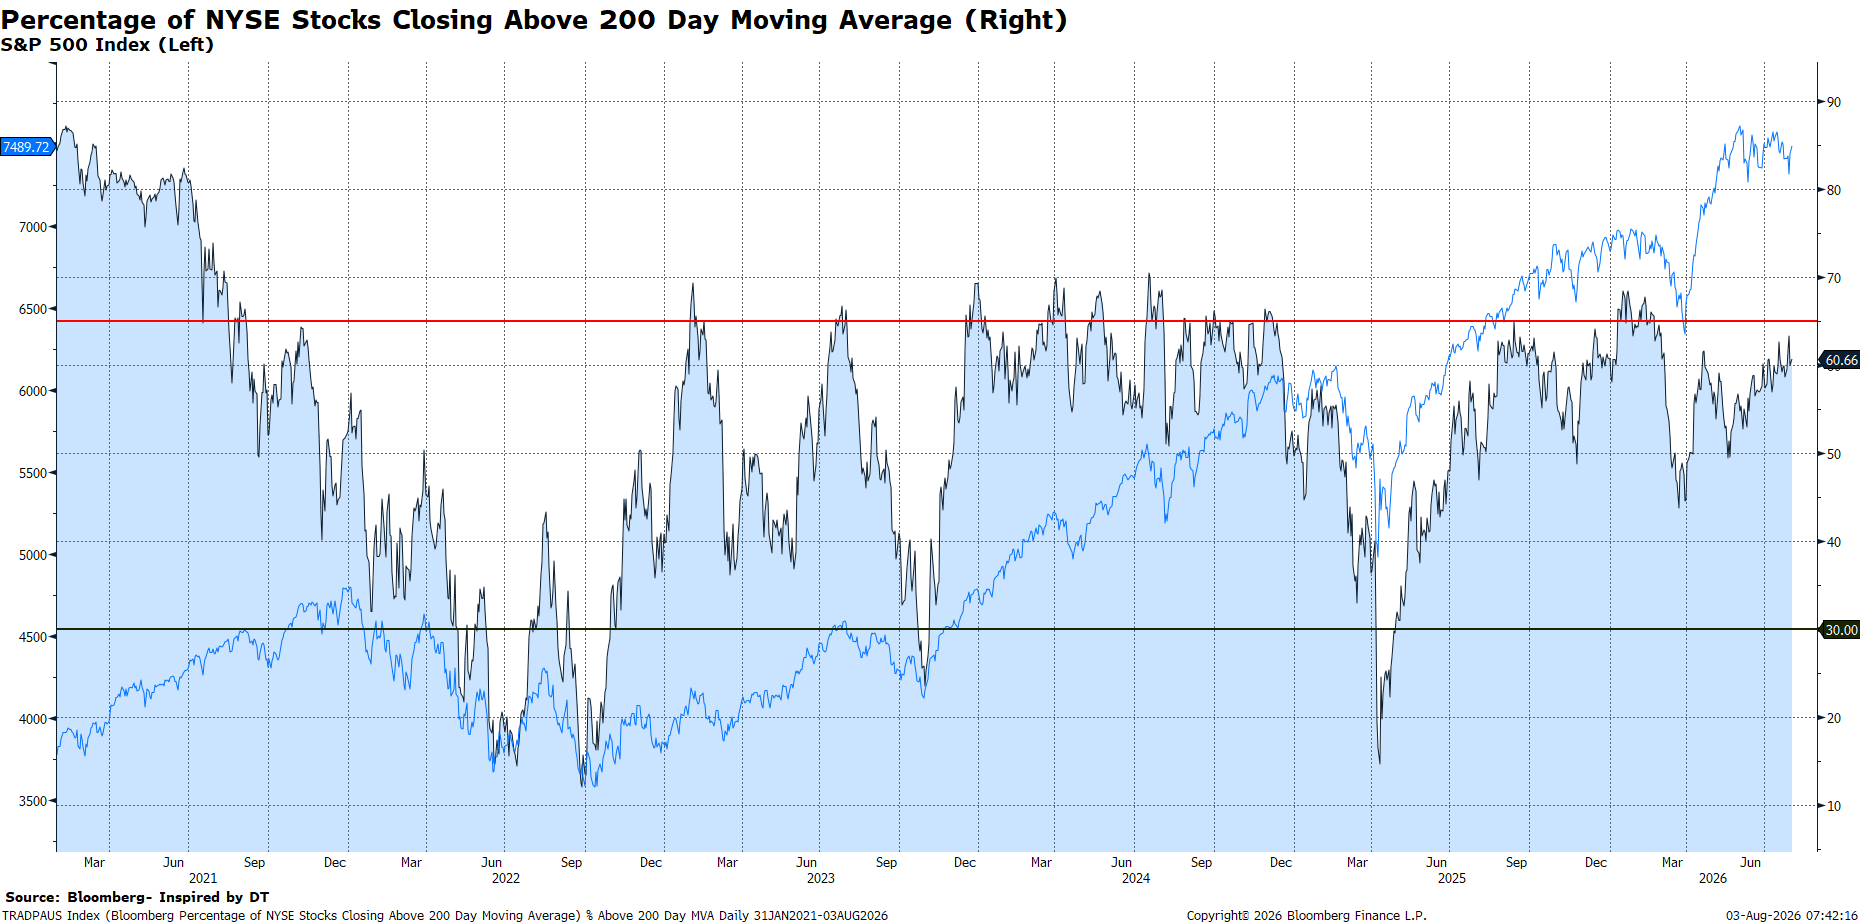
Click to enlarge. As of 08/03/2026 via Bloomberg.
That’s all for this edition - see you next month for more charts!
Notes:
We are pleased to share a monthly version of our internal Risk Dashboard with our clients and subscribers from the investing public at large. A few reminders:
The HVP Risk Dashboard is not an equity or credit research product and not a specific recommendation to make any investment decisions.
Past performance may not be indicative of future results.
Data is generally presented here without comment.
HVP and affiliates may have positions in or against any securities referenced.
This is a chart heavy report. Clicking or tapping a chart will open it in a new window. While we all live on our phones, the best viewing will probably be on a larger screen such as your iPad, laptop, or desktop.
The Risk Dashboard is complimentary for HVP clients, institutional partners, and members of the investing public we hope decide to become clients!