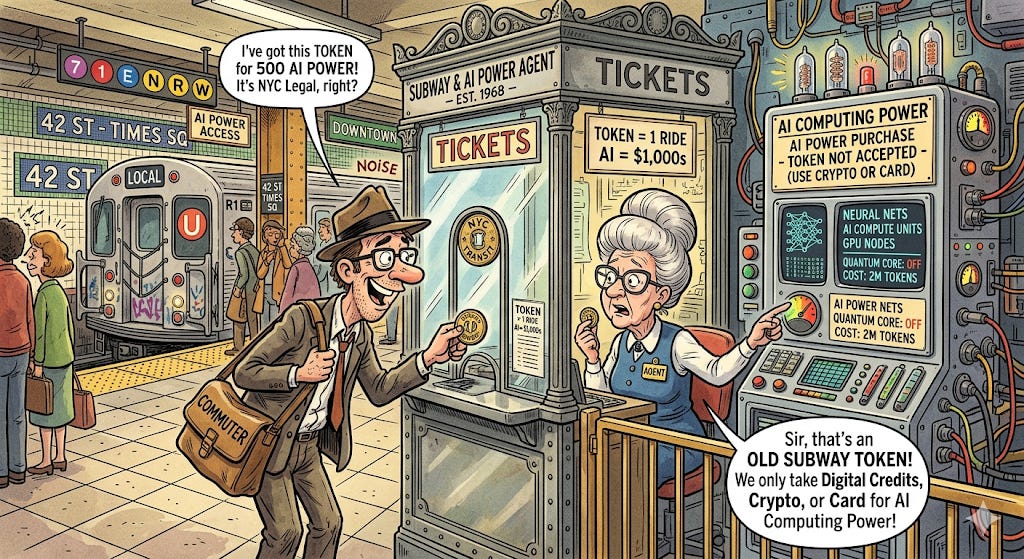
Markets are suggesting that the future will be “token” operated. Phased out by the MTA for subways and buses in 2003, tokens are back for the AI age. But what exactly is a token? Definitions include:
1) a basic unit of data for an AI model process
2) the Lego brick of AI
3) about 60-75 words
Earlier this month, Goldman Sachs Research made a splash with their forecast that token usage would grow 24x between now and 2030. Anything with even the most remote chance of growing 24x (other than perhaps common bacteria cells!) merits some consideration. The numbers become hard to fathom when they get into the quintillions. We can use some common sense to realize that for any level of mass adoption, the cost of computing power, tokens, memory, and energy will need to come down in order to meet even the more conservative projections around AI use. Notably even though software companies have been weak this year, (the ongoing SaaS-acre) it is currently estimated that 2/3 of tokens are used by consumers and hobbyists, and only 1/3 by enterprise customers. Most large businesses have their data spread across several legacy platforms and systems. Until that data is unified, the potential of AI and a large part of the most optimistic forecasts cannot be readily achieved. In this way, newer entrants and younger companies (less data history) find themselves with an edge - if they can afford the investment.
What has been playing out in markets this spring is the collision of AI & digital optimism with the physical world as the war in Iran has led to an energy price spike. Those investors and analysts most familiar with energy markets have so far sounded like chicken little calling for jet fuel, gasoline, helium, and other petroleum based disruptions to flow through to inflation readings and grind industrial production to a halt. The inflation point is clear, and they may still be right on the industrial front depending on the path of the conflict. Since the announcement of the ceasefire at the end of March, markets have been giving investors the message that the AI growth story matters more. Our Christopher Davis discussed some of these tensions in a recent interview which you can watch here from The Watch List on Schwab Network.
Q1 earnings reporting season has been quite strong. Data compiled by Bloomberg shows a standout 27% earnings growth year over year for the 473 S&P 500 companies that have reported as of this writing. Outside of a post recessionary bump that is a stellar figure. Bears will say that is old news as it only included 1 month of the war and little of the ensuing inflationary impact. Accountants will tell you that this is a strong 1/4 of the year in the bag for American business. Taking a look under the hood is even more interesting - estimates vary but some suggest that 6-8% of the 27% earnings growth can be attributed to mark ups in the value of private company stakes (like SpaceX) held by public companies. Whether we like it or not, we are all venture capitalists now.
To borrow a phrase from our friend and NYT best selling author Larry McDonald, we try “to listen when markets speak” !
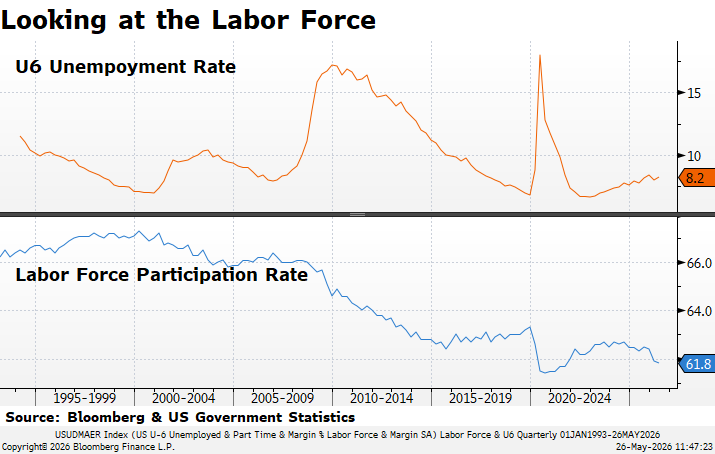
U6 is a wider measure of unemployment than the commonly cited headline number. Data most recently available via Bloomberg.
Tech Sector Layoffs:
2026: 115,430 employees / 152 companies
2025: 123,941 employees /269 companies
2024: 152,074 employees/546 companies
2023: 263,180 employees/1,191 companies
2022: 166,269 employees/1,064 companies
(layoffs.fyi as of 5/26/2026)
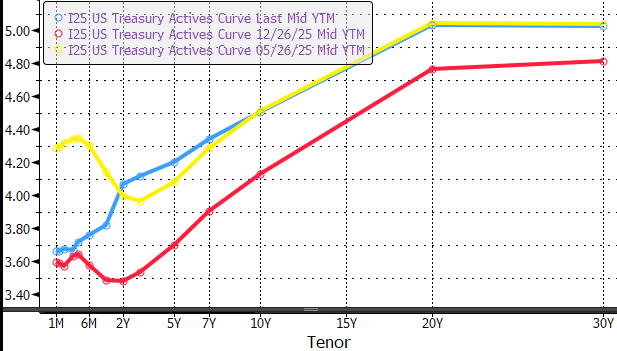
The Movement of the US Treasury Yield Curve
Blue = Current; Red = 6 months ago; Yellow =1 Year Ago
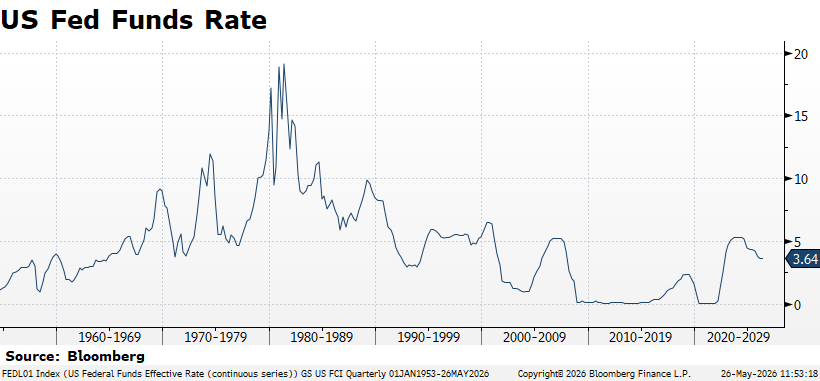
Fed Funds on a LONG time scale - 1953-present. As of 5/26/26.
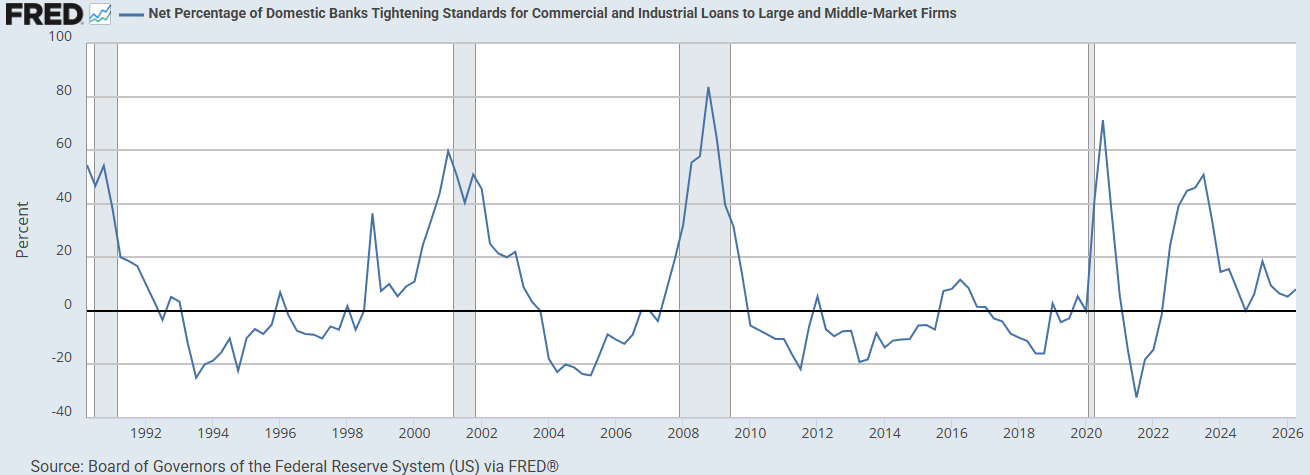
Net % of Banks Tightening Lending Standards for C&I Loans
As of 5/4/26 via FRED & St. Louis Federal Reserve Board
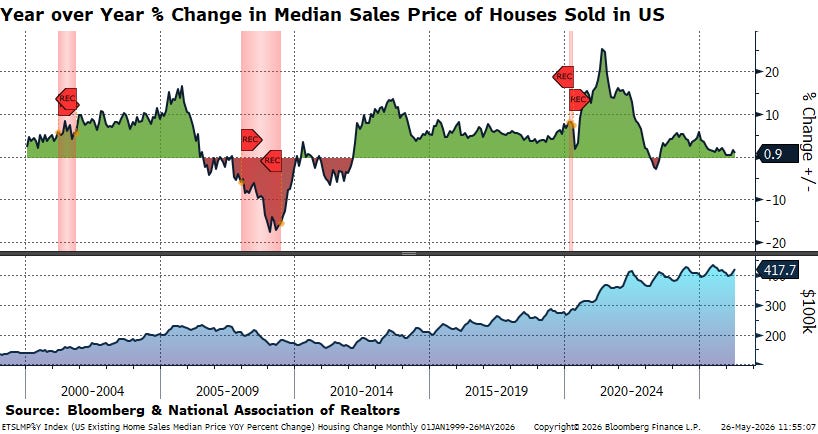
Looking at Housing
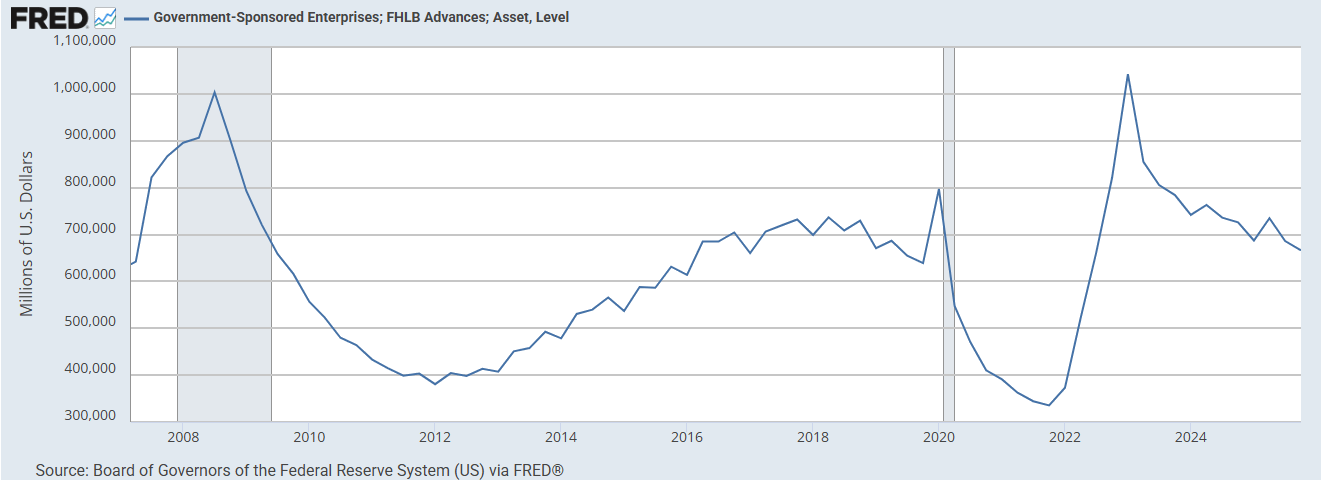
Canary in the Coal Mine: FHLB Borrowings
As of 3/19/26 via FRED & St Louis Federal Reserve. Next update 6/11/26.
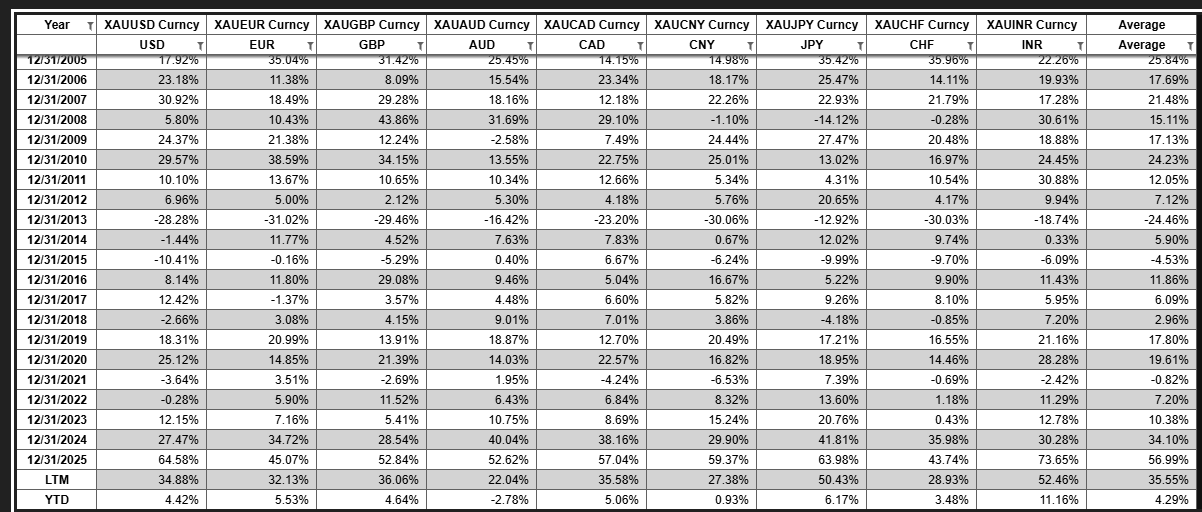
Performance of Gold in Major Currencies - % Change
As calculated by HVP Research as of 5/26/26. Raw data via Bloomberg.
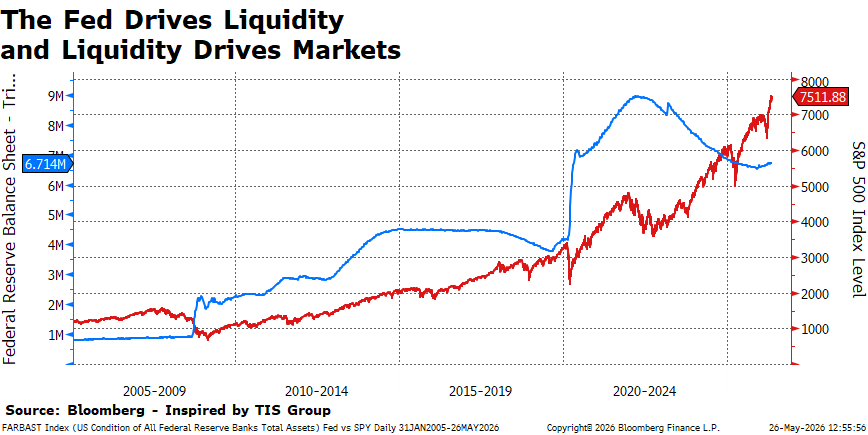
Broad Market Levels
Blue & Left Scale - Fed Balance Sheet in USD. Red & Right Scale S&P 500 Index level. Via Bloomberg as of 5/26/2026.
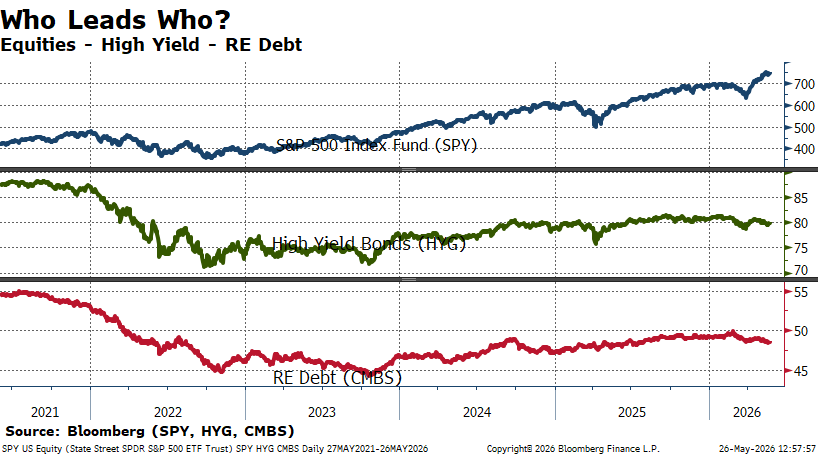
Top Panel/Blue = SPY; Middle Panel/Green = HYG; Bottom Panel/Red = CMBS. As of 5/26/2026.
Moving Averages
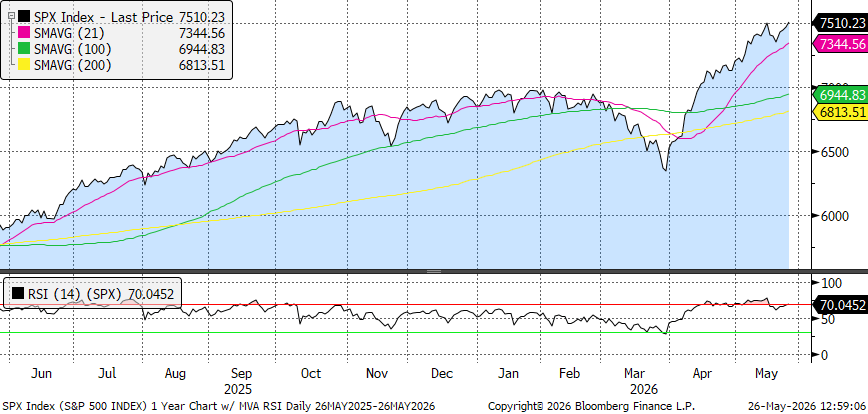
S&P 500
S&P 500 Index 1 Year trailing, with moving averages and RSI. Chart via Bloomberg as of 05/26/2026.
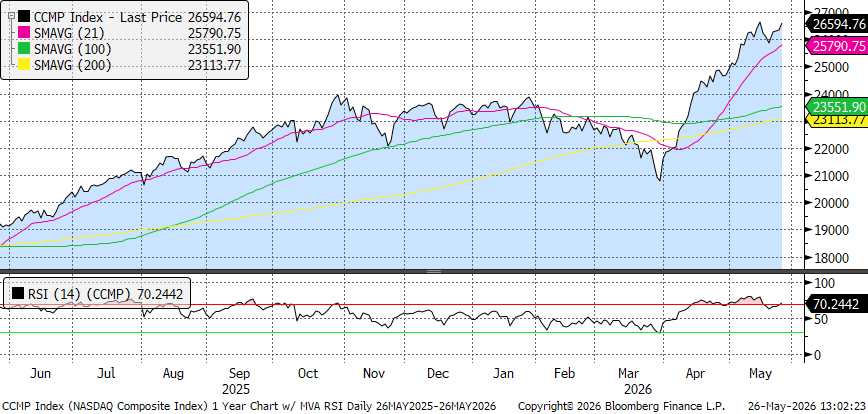
Nasdaq
NASDAQ Composite Index 1 Year Trailing, with moving averages and RSI. Chart via Bloomberg as of 5/26/2026.
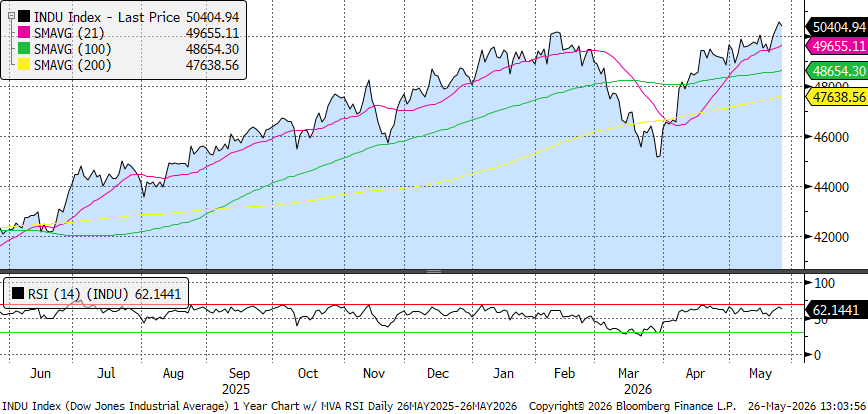
Dow Jones Industrial Average
Dow Jones Industrial Average 1 Year trailing, with moving averages and RSI. Chart via Bloomberg as of 5/26/2026.
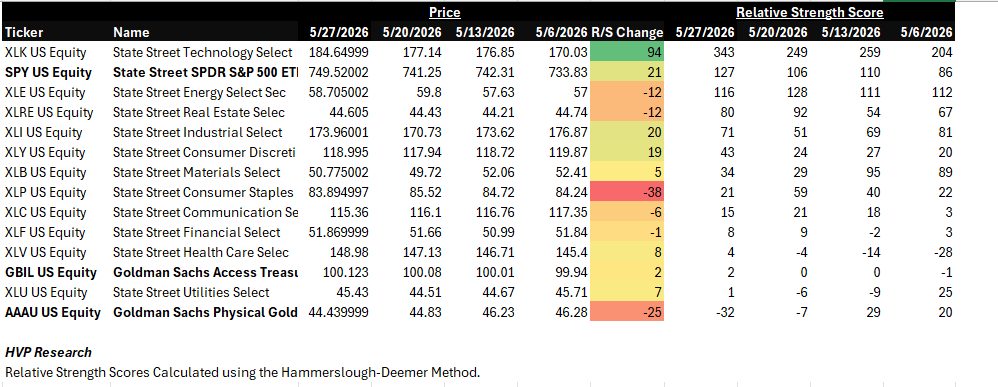
A Look at the S&P 500 Sectors:
Click to enlarge. As calculated by HVP Research. Gold, T-Bills, and S&P 500 ETF bolded as reference levels. As of 5/26/2026.
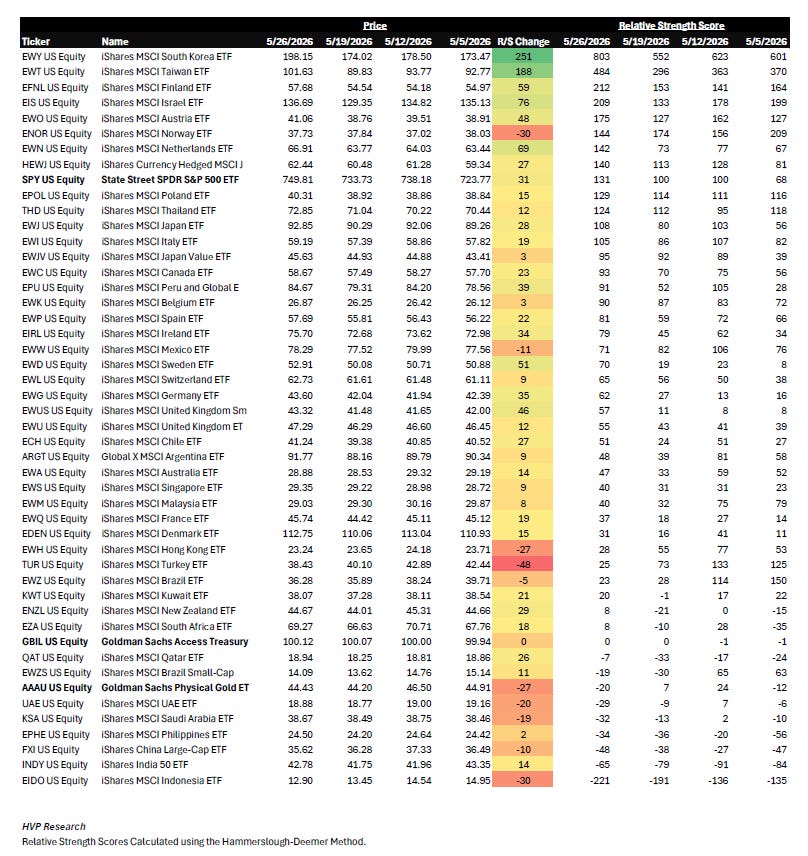
A look around the (multipolar) world:
Click to enlarge. As calculated by HVP Research. Gold, T-Bills, and S&P 500 ETF bolded as reference levels. As of 5/26/2026.
Seasonality
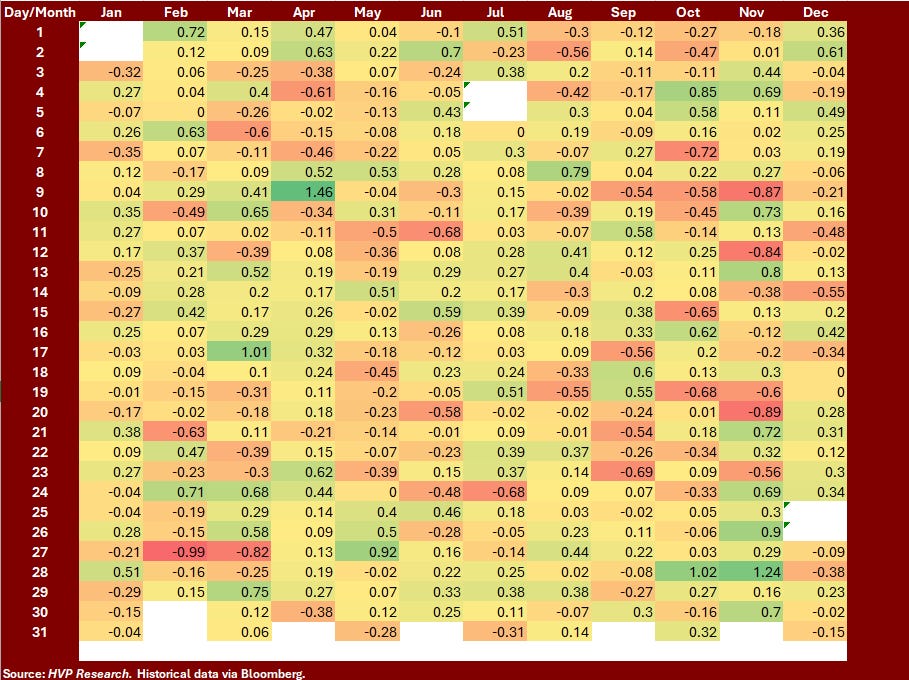
Average Daily S&P 500 Index Returns over the Past 20 Years:
20 Year Average back to 2006, raw data via Bloomberg, as calculated by HVP Research. As of 5/26/2026.
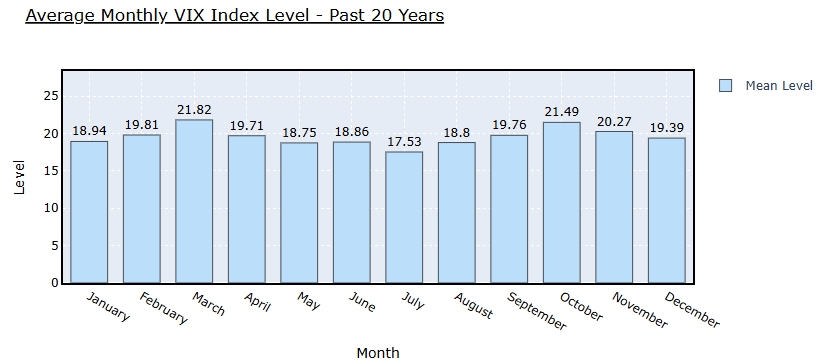
As calculated by HVP Research as of 5/26/26 with raw data from Bloomberg. The only thing that may feel “normal” these days in the level of the VIX.
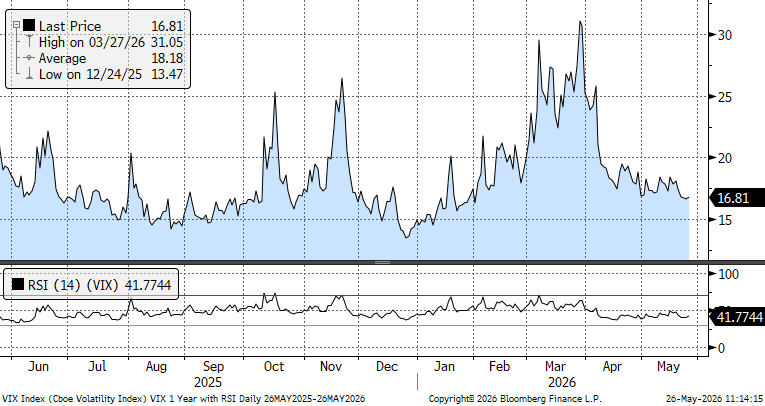
1-Year Trailing Chart of the VIX with RSI
Year Trailing Chart of the VIX with RSI. The VIX is currently 16.81. Data as of 5/26/26.
Sentiment & Technical Indicators
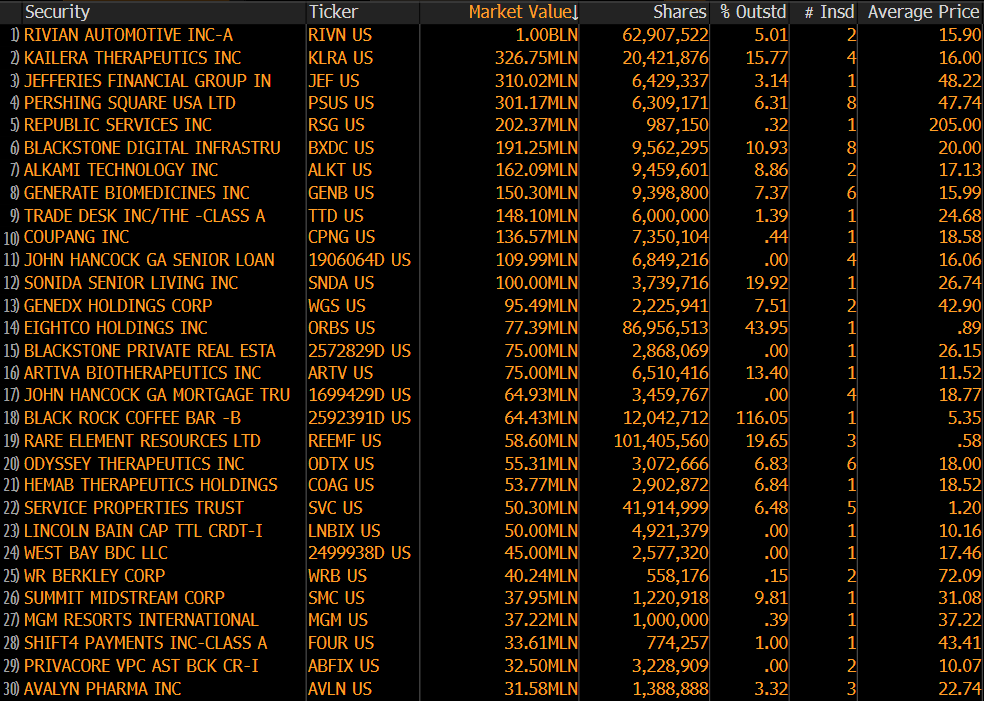
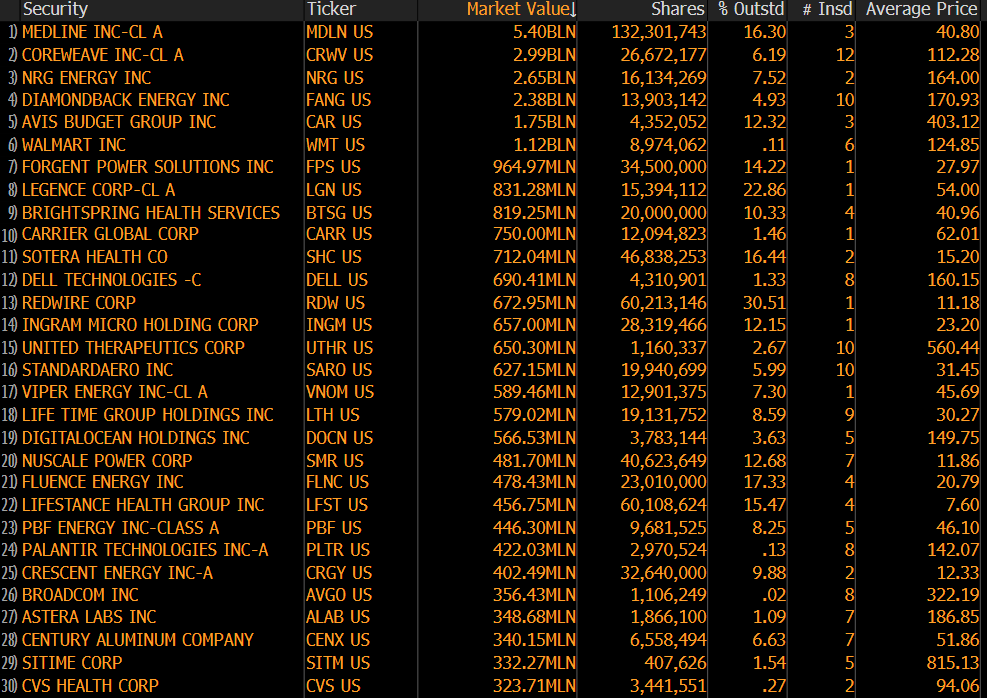
Insider Buying & Selling
Top Buys in the Last 3 Months (as of 5/26/26 via Bloomberg)
Top Sells in the Last 3 Months (as of 5/26/26 via Bloomberg)
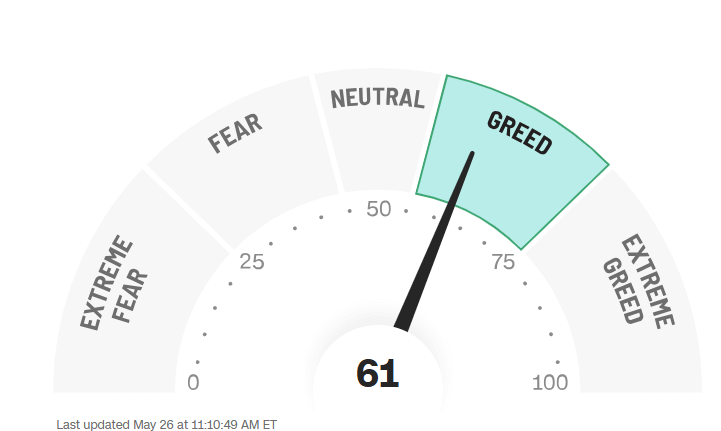
CNN Fear & Greed Indicator
CNN Fear & Greed Indicator As of 5/26/2026. https://www.cnn.com/markets/fear-and-greed
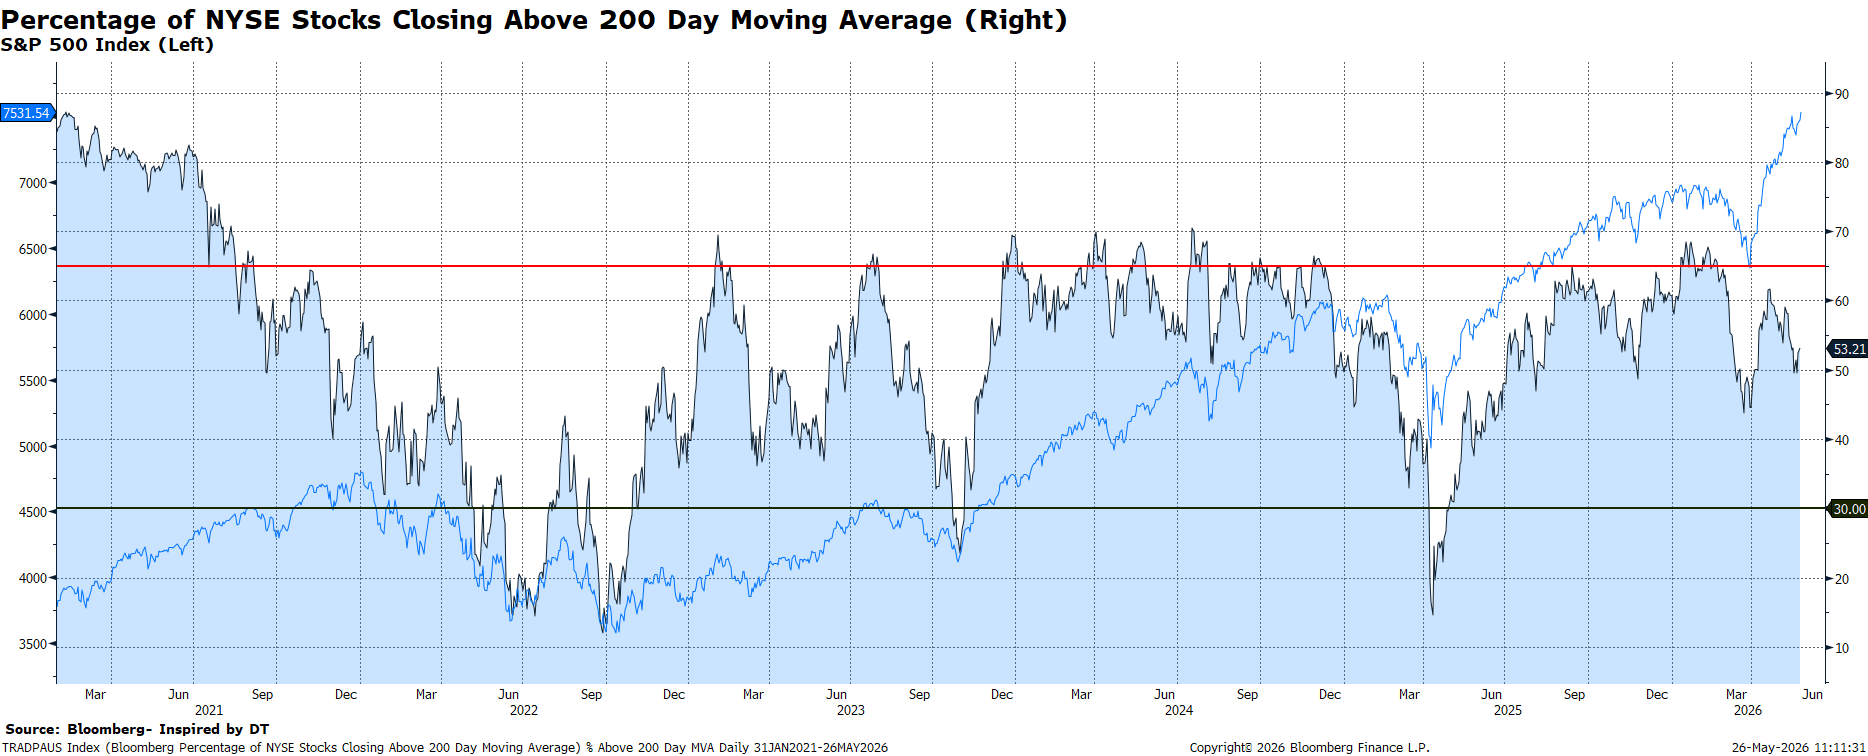
Click to Enlarge. Chart via Bloomberg as of 5/26/2026.
That’s all for this edition - see you next month for more charts!
Notes:
We are pleased to share a monthly version of our internal Risk Dashboard with our clients and subscribers from the investing public at large. A few reminders:
The HVP Risk Dashboard is not an equity or credit research product and not a specific recommendation to make any investment decisions.
Past performance may not be indicative of future results.
Data is generally presented here without comment.
HVP and affiliates may have positions in or against any securities referenced.
This is a chart heavy report. Clicking or tapping a chart will open it in a new window. While we all live on our phones, the best viewing will probably be on a larger screen such as your iPad, laptop, or desktop.
The Risk Dashboard is complimentary for HVP clients, institutional partners, and members of the investing public we hope decide to become clients!