

March Madness - 2026 Edition
War in the Persian Gulf Hits Investor Sentiment
![Man, the State, and War : A Theoretical Analysis Waltz, Kenneth N.; Walt, Stephen M. (FRW) [Used - As new] [Hardcover]](https://substackcdn.com/image/fetch/$s_!-Wdz!,f_auto,q_auto:good,fl_progressive:steep/https%3A%2F%2Fsubstack-post-media.s3.amazonaws.com%2Fpublic%2Fimages%2F2e167760-918c-439a-a98e-a68943a7b7e9_201x310.webp "Man, the State, and War : A Theoretical Analysis Waltz, Kenneth N.; Walt, Stephen M. (FRW) [Used - As new] [Hardcover]")
With a few trading days remaining, March 2026 may be one of the toughest months for equities since 2022. The third month of the quarter, with earnings season wound down, is usually the most headline driven, but with the outbreak of war in the Persian Gulf that feels like an understatement. For this month’s HVP Risk Dashboard, our thought is to focus on a few charts and indicators that we are watching most closely. Often our indicators are little changed week to week or even month to month. As markets seek to price the range of potential outcomes, the rate of change on a few of the indicators has picked up markedly. We’ve included some extra indicator specific commentary this month below.
The shock of the oil price spike and uncertainty around the duration of the conflict remind us of the “Liberation Day” tariff experience in April of 2025. Then as now, we know the precise cause of the selloff - then tariffs, now war. That means we also know how markets can regain their footing – a resolution to the hostilities, or even just a reduction to the sporadic and lower level of conflict that has plagued the Middle East for decades. Both of those are outcomes the market can live with, and we think could be swiftly priced if that is how events unfold. Leaving politics out of it. our assumption is that despite outward appearances, actors on the world stage work in their own rational self-interest. Professor Kenneth Waltz wrote the classic Man, The State, and War in 1959 and ever since it has been a staple of realist international relations theory. His work argues that the analyst ought to review the situation across the “three images” – individuals, states, and the international system. Although we’ll leave parsing that against today’s conflict out of this month’s note, we think it is a particularly apt framework.
Months like this remind us of the Warren Buffett adage that the market is a mechanism for transferring wealth from the impatient to the patient. We remain nimble and ready to act, but balance that with a studied patience as we evaluate the shares of the businesses we own (and would like to own).
If you haven’t already….
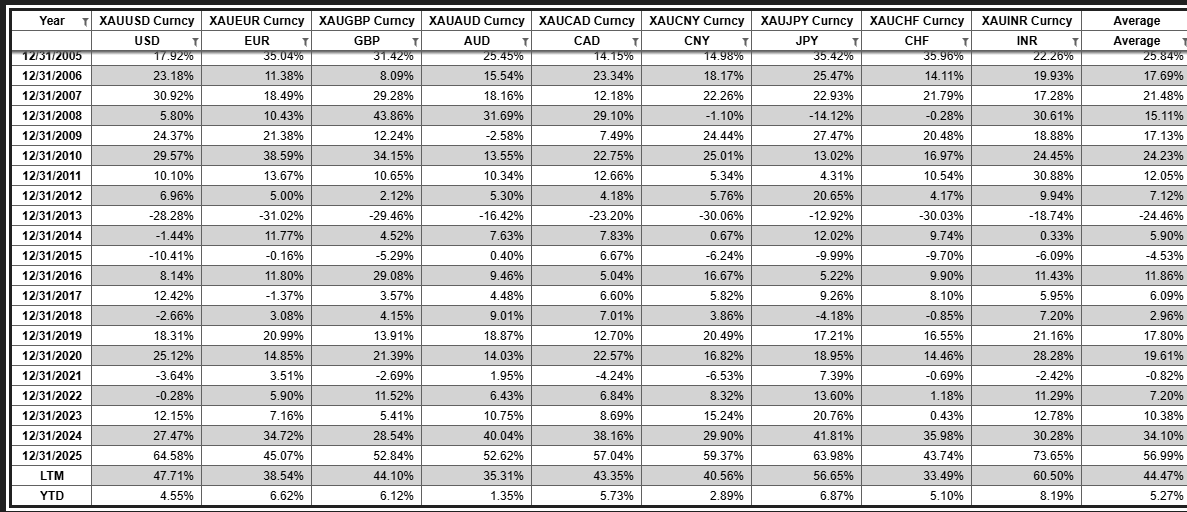
The Movement of the US Treasury Yield Curve
Despite it all, one of the most “normal,” upward sloping yield curves we have had in years…
Blue = Current; Red = 6 months ago; Yellow =1 Year Ago
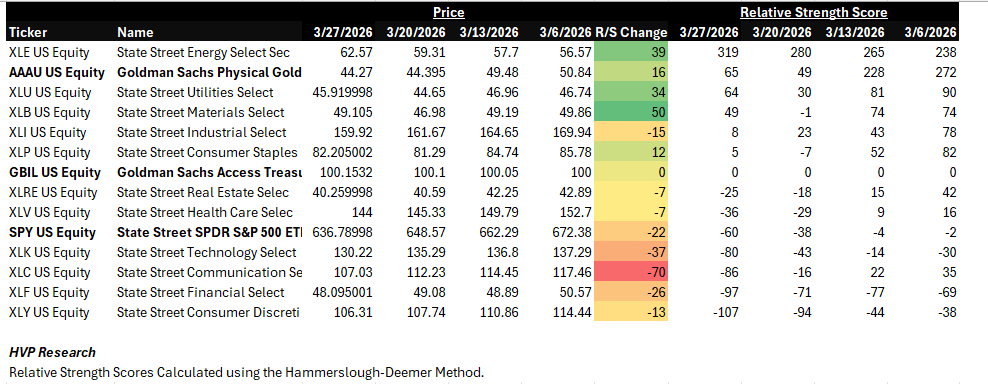
Performance of Gold in Major Currencies - % Change
The price of gold in most currencies has moderated substantially since the outbreak of war. A confluence of factors could be at work - US dollar strength, some central banks forced to sell gold to defend their currencies, speculative longs reducing risk in the face of uncertainty, and perhaps the most salient explanation: the yellow metal is many things to different people, but it is still a commodity that moved too far too fast.
A Look at the S&P 500 Sectors:
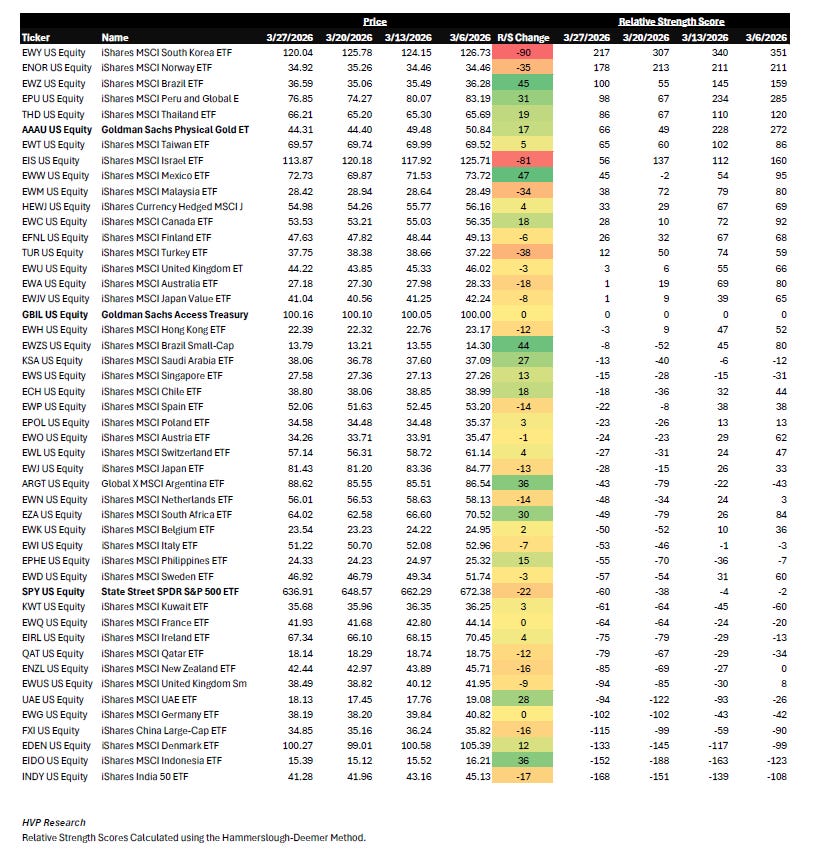
A look around the (multipolar) world:
When we look at these tables, it isn’t just about wanting to own the sectors or countries at the top of the list. Take a look at the color coded R/S Change value to see those that are moving up the list and those that are moving down the list with the greatest velocity. On the country list below, consider which national markets are above Gold, US Treasury Bills, or the S&P 500 as a proxy for the US market. Right now the bottom of the list is particularly interesting - both nations in the Persian Gulf and those dependent on oil & LNG exports from the gulf are clustered together. Consider how a resolution or continuation of hostilities might reconfigure this table…
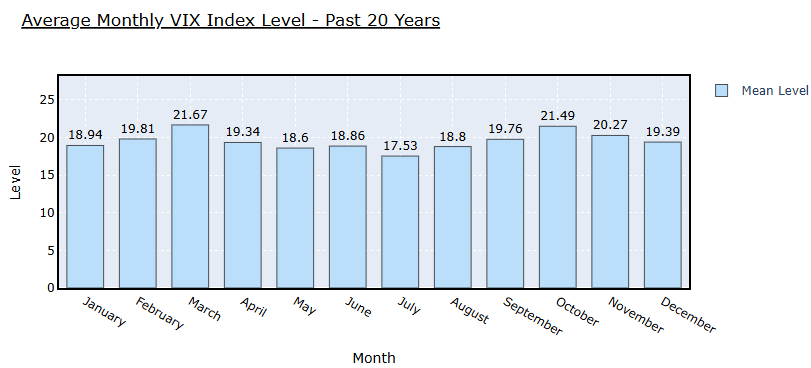
Average Daily S&P 500 Index Returns over the Past 20 Years:
Time will tell whether seasonal patterns hold, but the start of Q2 in April has on average brough lower volatility levels.
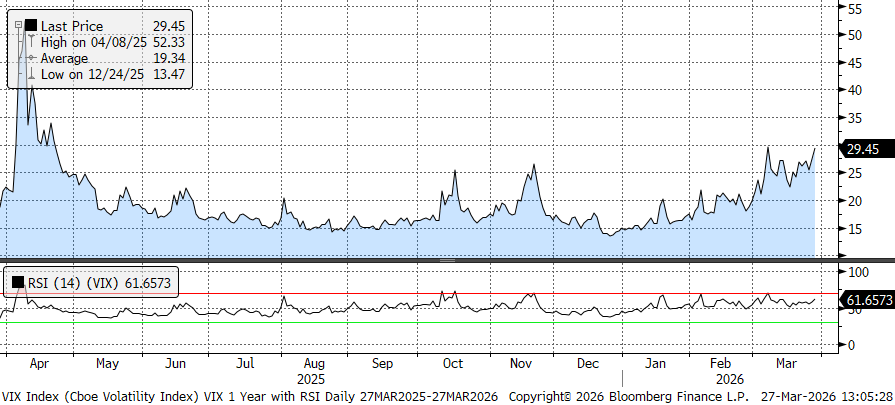
1-Year Trailing Chart of the VIX with RSI
Compare the levels of a “War VIX” currently to a “Tariff VIX” one year ago…
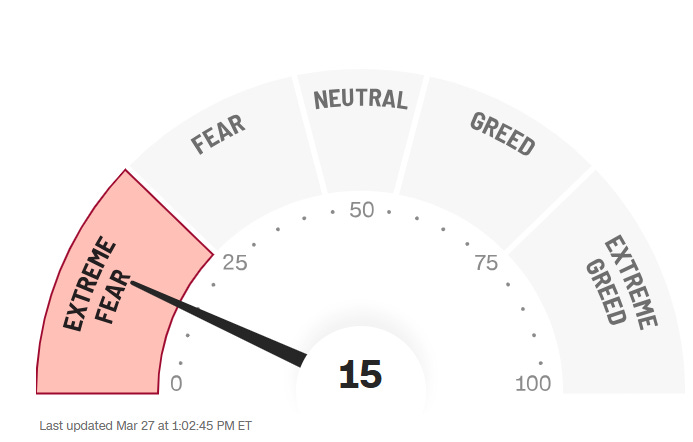
CNN Fear & Greed Indicator
That’s all for this edition - see you next month for more charts!
Notes:
We are pleased to share a monthly version of our internal Risk Dashboard with our clients and subscribers from the investing public at large. A few reminders:
The HVP Risk Dashboard is not an equity or credit research product and not a specific recommendation to make any investment decisions.
Past performance may not be indicative of future results.
Data is generally presented here without comment.
HVP and affiliates may have positions in or against any securities referenced.
This is a chart heavy report. Clicking or tapping a chart will open it in a new window. While we all live on our phones, the best viewing will probably be on a larger screen such as your iPad, laptop, or desktop.
The Risk Dashboard is complimentary for HVP clients, institutional partners, and members of the investing public we hope decide to become clients!