New Fed Chair, Precious Metals Fly, & Investors Scrutinize AI Spend
Jan 30, 2026
We started to put together this month’s markets commentary a few times, but each time we did, it seemed tomorrow’s headlines might just make this piece out of date in an instant. Sneaking in just under the wire as a January note allows us to have the benefits of seeing the early response to actions in Venezuela, the ferocious move in metals start to correct, responses to big tech earnings, and as of this morning, the of end the parlor game of who would be nominated to be the next chairman of the Federal Reserve.
In our 10 Surprises for 2026 one of our predications was that Latin America would be a focus for investors and for geopolitics. We were surprised how quickly that flashpoint came. Time will tell what the long term effects on the region, energy markets, and the international order are, but for now there has been a minimal response in markets. The combination of low multiples and cyclical industries still has investors looking at allocations to Latin America.
The move in metals, particularly silver and gold (cue the Burl Ives!) that started in 2025 has continued in 2026. We remind ourselves that commodities are one of the ways to make or (with maybe even more frequency) lose a fortune quickly - when prices move, they can take on a life of their own. In a brisk and wide ranging interview with BNN Bloomberg, our Christopher Davis reminded viewers that there can be symmetry in charts - steep ascents may be followed by equally sharp pullbacks. After a torrid run, today on January 30th, we are starting to see that pullback and consolidation take place. You can view the full clip, including some comments on what happened at the WEF in Davos, Switzerland at the YouTube link below.
With reports from the likes of Apple, Microsoft, Meta, and Tesla (not to mention many great companies who grab fewer headlines), we are starting to see a divergence between how investors are treating different firms’ AI strategies. Where Microsoft and Meta are spending big to build big, Apple is spending dramatically less and building the next version of Siri in collaboration with Google to grow its suite of Apple Intelligence features. We might argue that quite logically, the market is rewarding those firms allocating their AI spend to their biggest and most profitable businesses. Investors are less willing to give these companies the benefit of the doubt on their other AI spending than in the past.
In some of the biggest news of the week, Kevin Warsh was nominated to succeed Jerome Powell as Chairman of the US Federal Reserve. Hot off the recording press, our Christopher Davis joined friends of HVP Larry McDonald and Robbert van Battenburg on their podcast The Lens this morning to discuss the Fed, rates, gold, silver, and the incredible scale of the upcoming IPO pipeline which includes SpaceX. The show was live streamed on X earning a few thousand viewers in real time. With much of the US feeling another deep freeze this weekend, it could be something to enjoy fireside or on the treadmill.
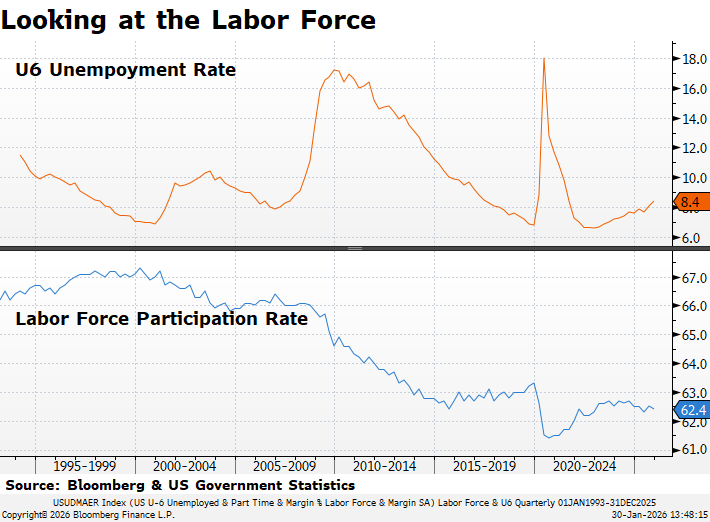
U6 is a wider measure of unemployment than the commonly cited headline number. Data most recently available via Bloomberg.
Tech Sector Layoffs:
2026: 22,668 employees / 18 companies
2025: 123,941 employees /269 companies
2024: 152,074 employees/546 companies
2023: 263,180 employees/1,191 companies
2022: 166,269 employees/1,064 companies
2025 Federal Sector Departures & “DOGE” Cuts:
Total YTD Federal Departures: 182,528
…of which DOGE Layoffs are: 71,891
(layoffs.fyi as of 1/30/2026)
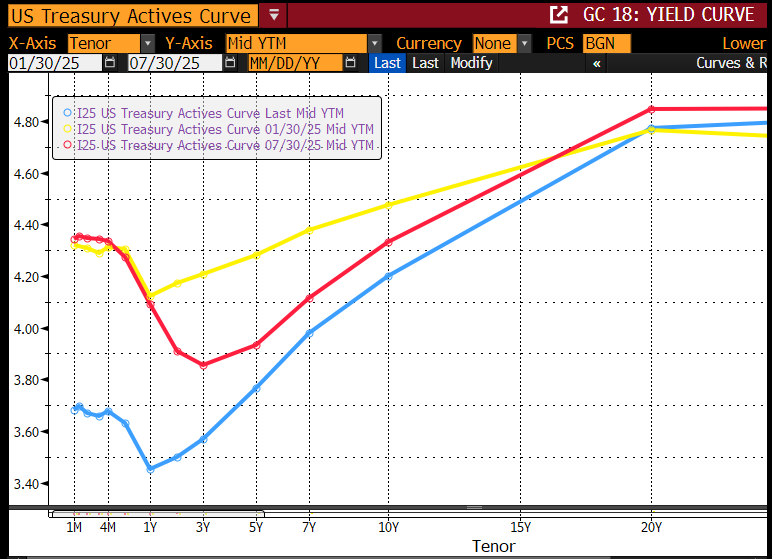
The Movement of the US Treasury Yield Curve
Blue = Current; Red = 6 months ago; Yellow =1 Year Ago
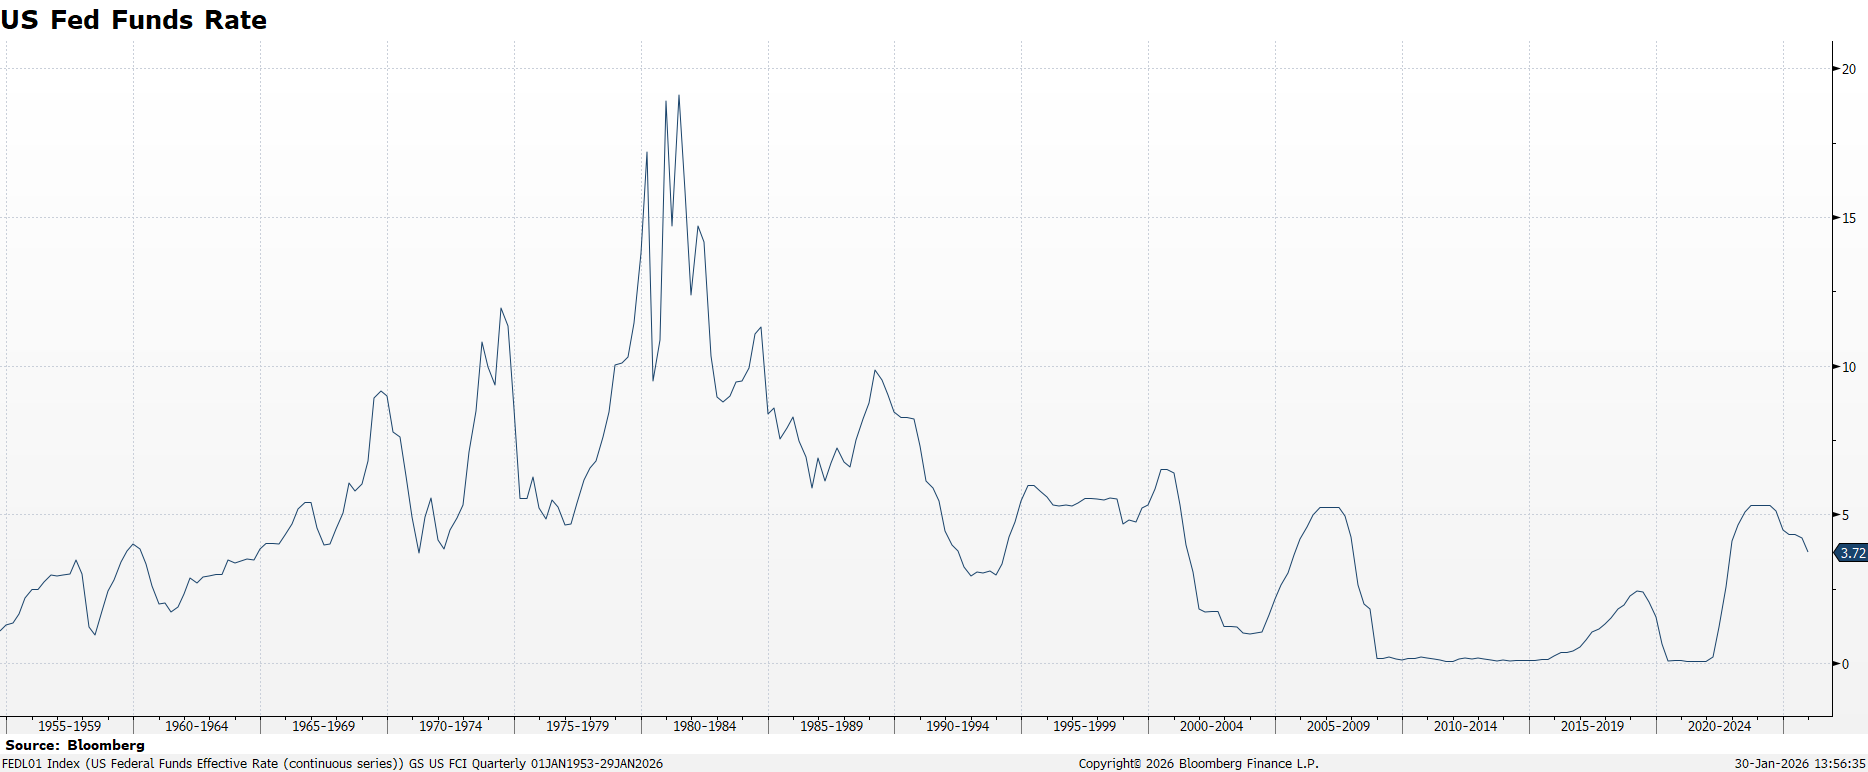
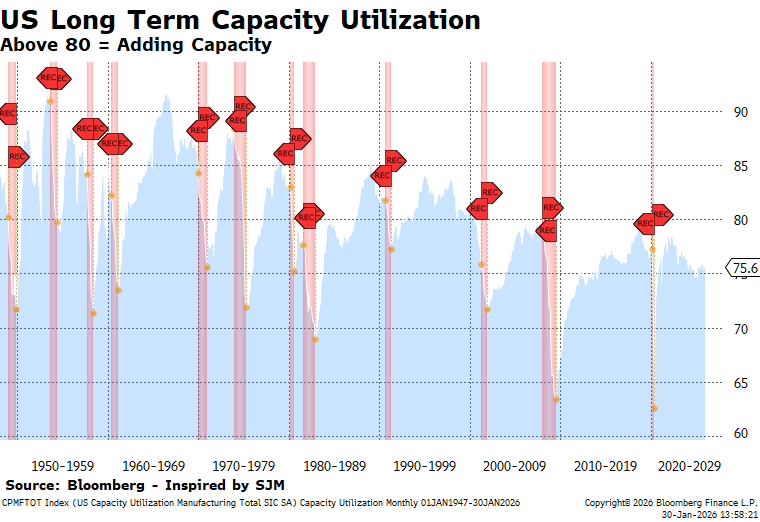
Fed Funds on a LONG time scale…1953 to present. Current rate 3.5-3.75% as of 1/30/26.
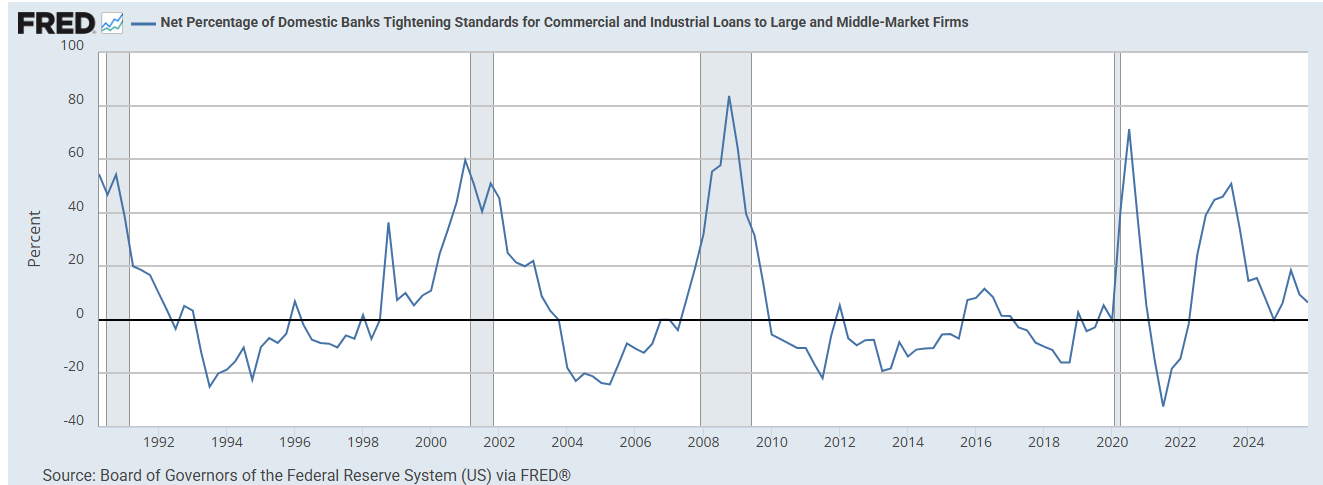
Net % of Banks Tightening Lending Standards for C&I Loans
As of 11/3/2025 via FRED & St. Louis Federal Reserve Bank.
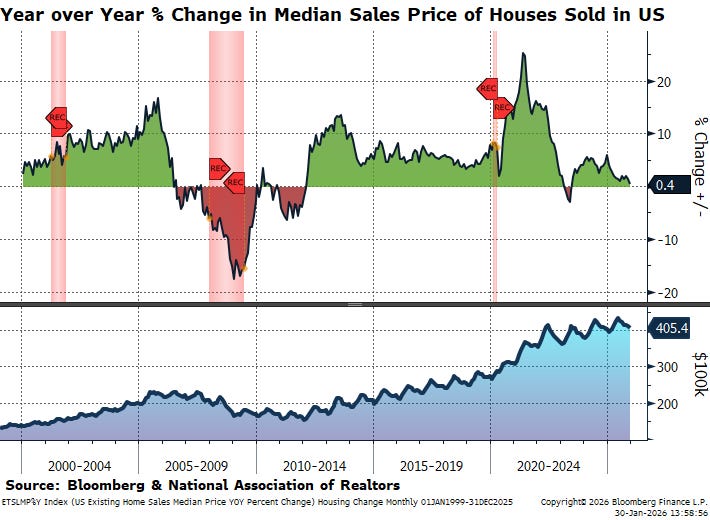
Looking at Housing
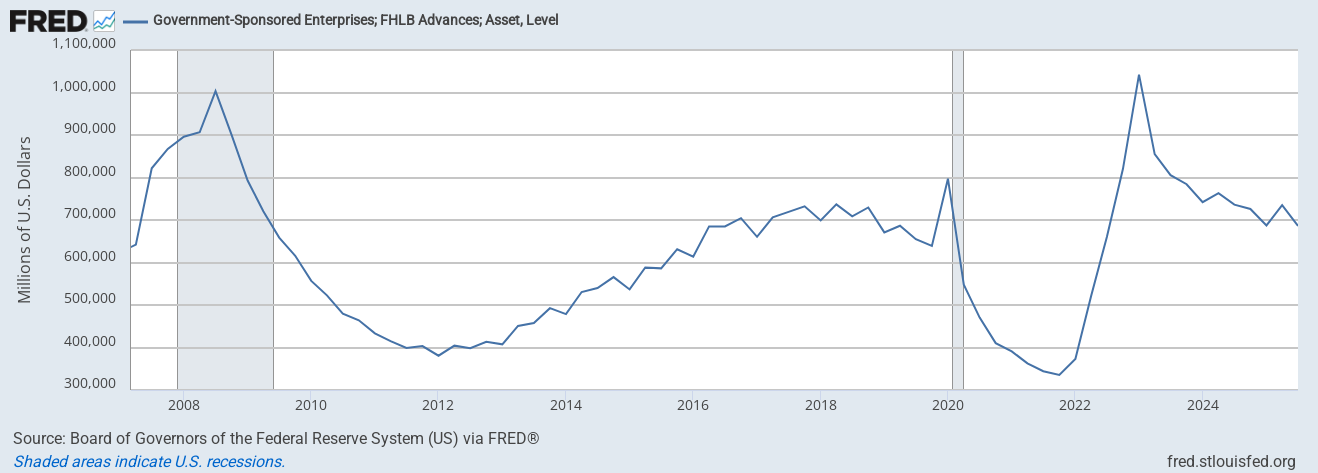
Canary in the Coal Mine: FHLB Borrowings
As of 1/9/2026 via FRED. St Louis Federal Reserve Data.
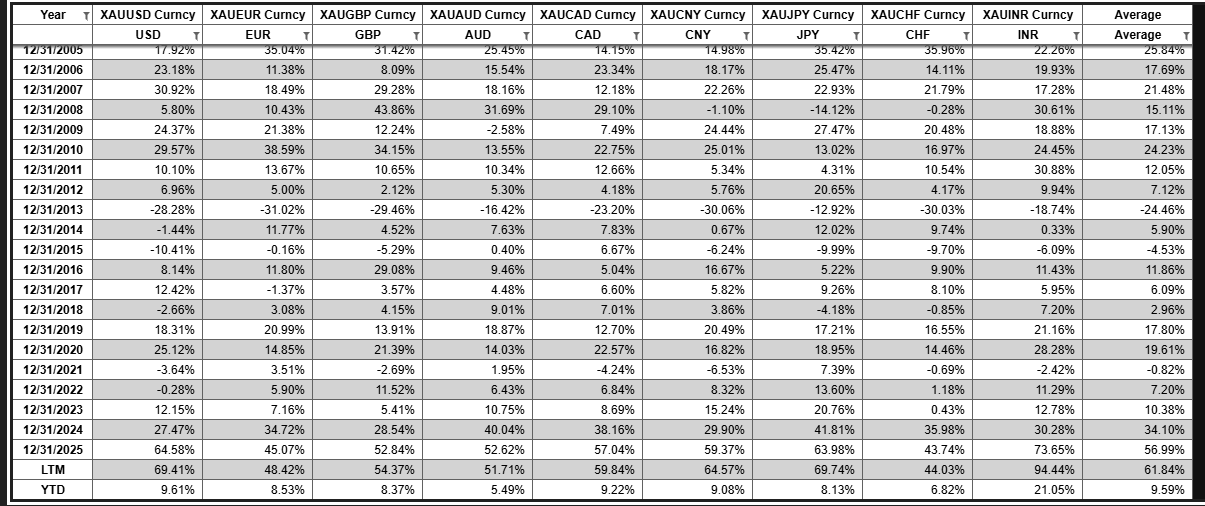
Performance of Gold in Major Currencies - % Change
Click to enlarge. As calculated by HVP Research. Raw data via Bloomberg as of 1/30/26 - the very chart referenced in the BNN Bloomberg video from earlier in Jan!
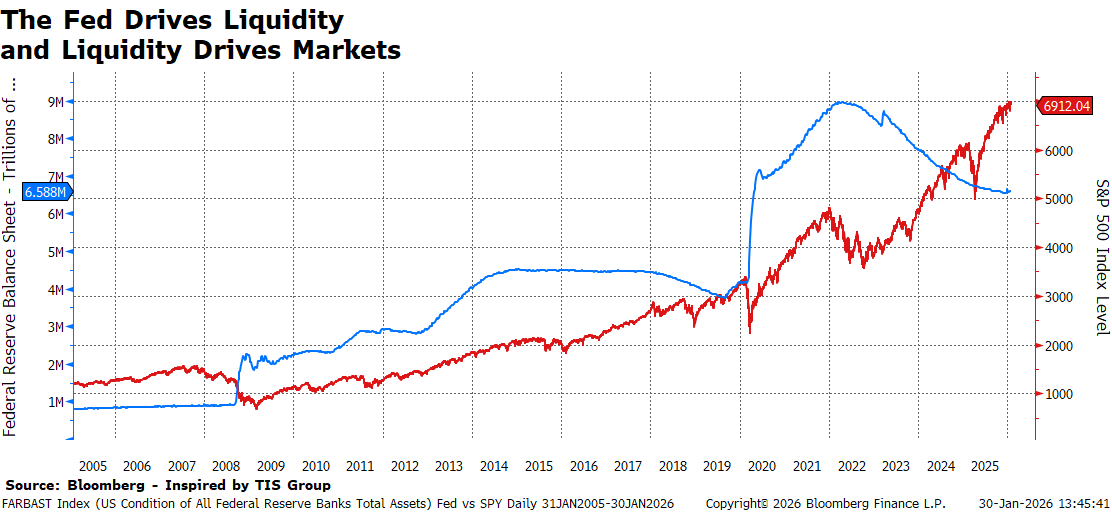
Broad Market Levels
Blue & Left Scale - Fed Balance Sheet in USD. Red & Right Scale S&P 500 Index level. Via Bloomberg as 1/30/26.
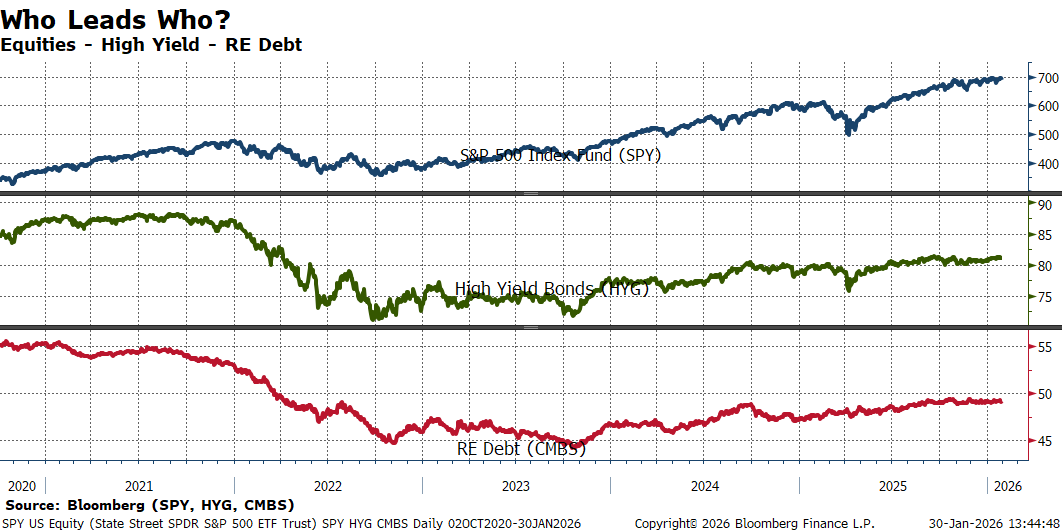
Top Panel/Blue = SPY; Middle Panel/Green = HYG; Bottom Panel/Red = CMBS. As of 1/30/2026.
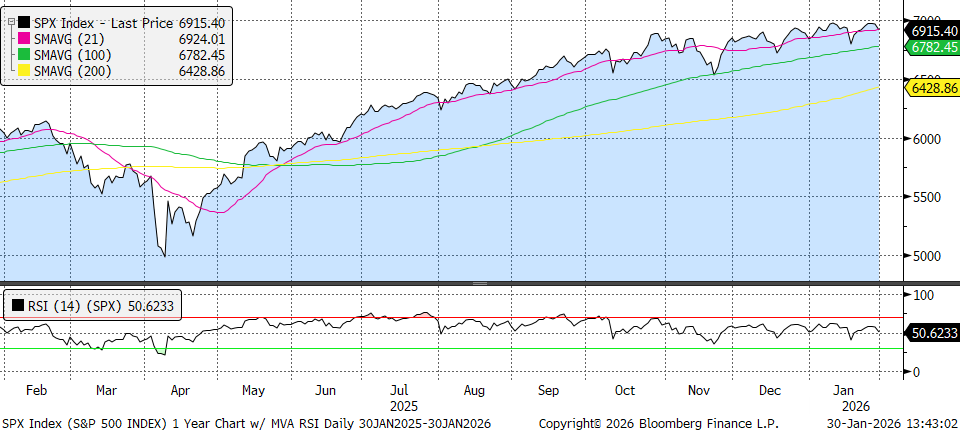
Moving Averages
S&P 500
S&P 500 Index 1 Year trailing, with moving averages and RSI. Chart via Bloomberg as of 1/30/2026
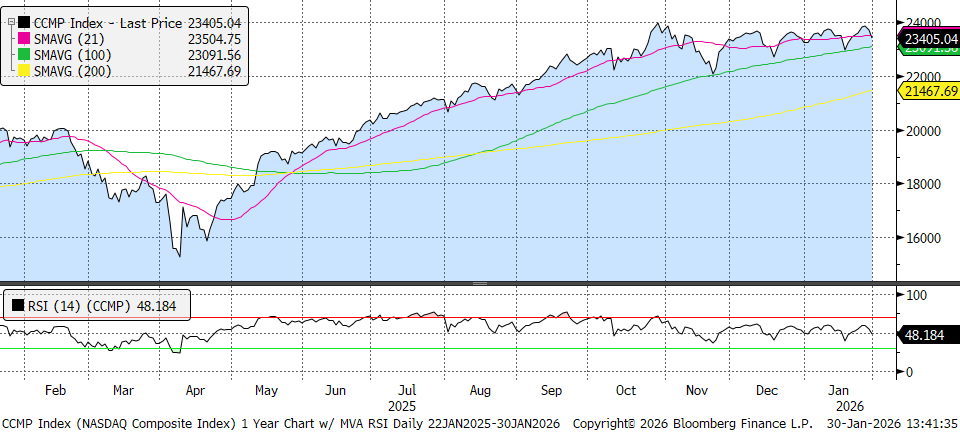
Nasdaq
NASDAQ Composite 1 Year trailing, with moving averages and RSI. Chart via Bloomberg as of 1/30/2026.
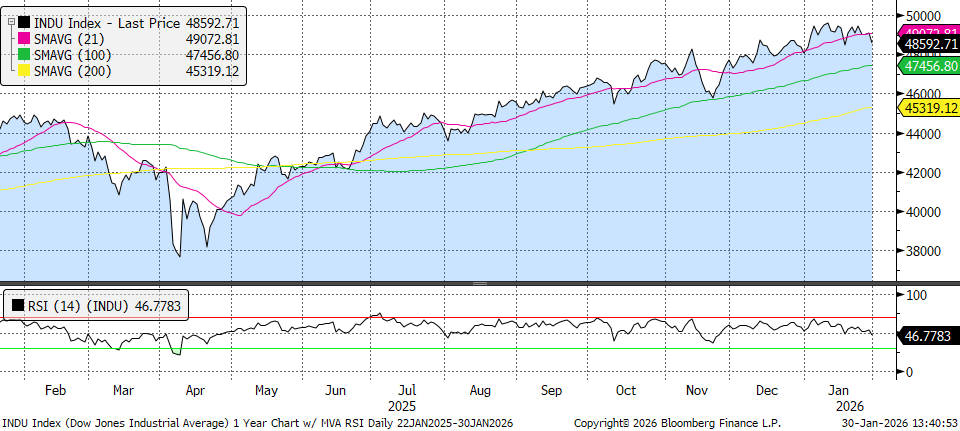
Dow Jones Industrial Average
Dow Jones Industrial Average 1 Year trailing, with moving averages and RSI. Chart via Bloomberg as of 1/30/2026.
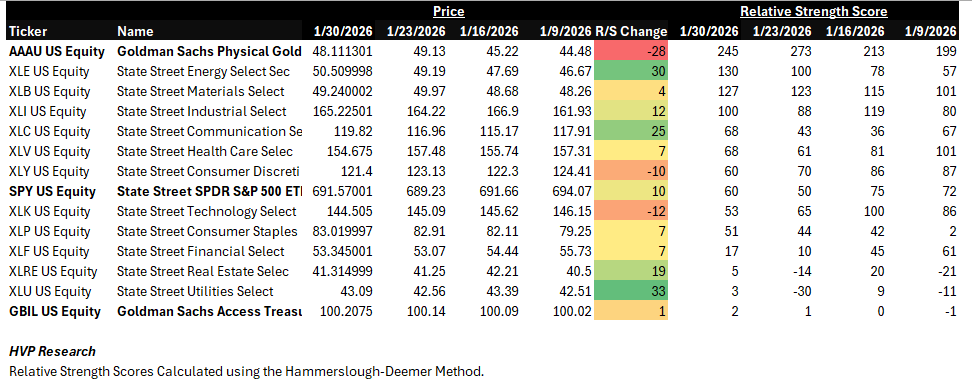
A Look at the S&P 500 Sectors:
As calculated by HVP Research. S&P 500, Gold, & T-Bills bolded as reference levels. Data as of 1/30/2026.
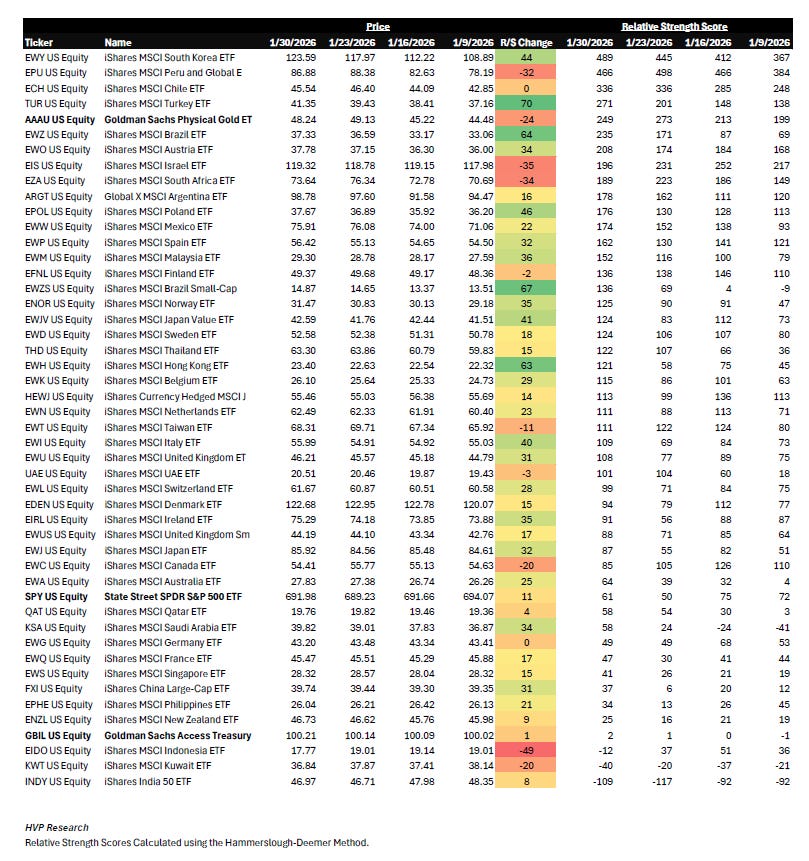
A look around the (multipolar) world:
As calculated by HVP Research. S&P 500, Gold, & T-Bills bolded as reference levels. Data as of 1/30/26.
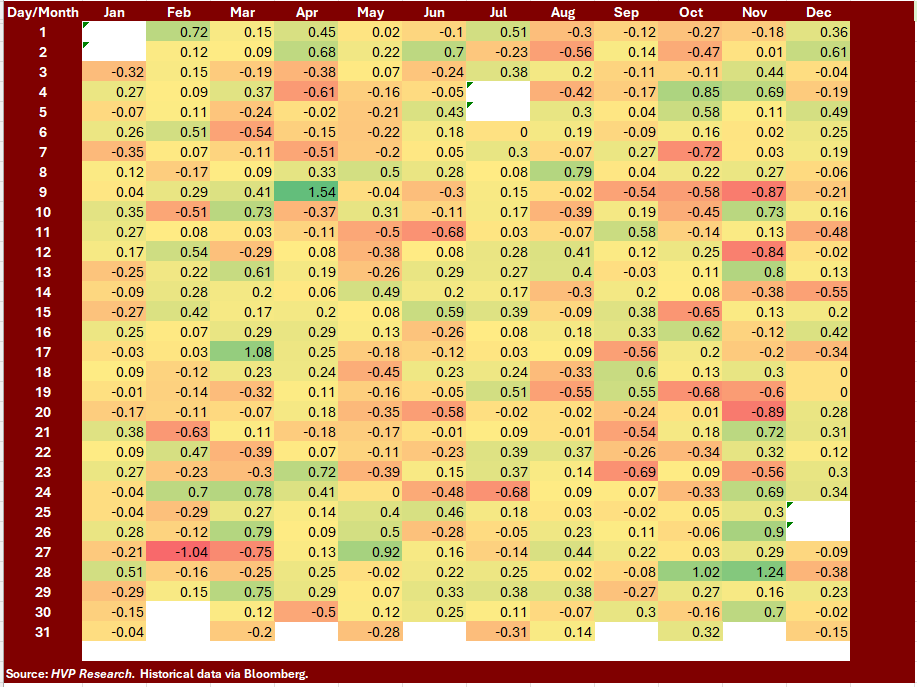
Seasonality
Average Daily S&P 500 Index Returns over the Past 20 Years:
Hudson Value Principle: Be cognizant of seasonality, but not a slave to it. Data as of 1/30/2026 via Bloomberg as calculated by HVP Research.
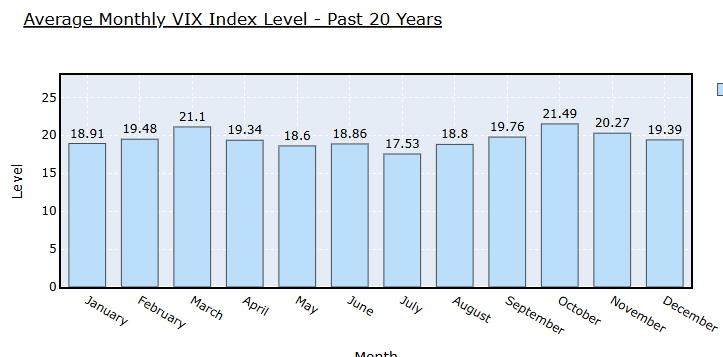
As calculated by HVP Research, the average monthly VIX Level over the past 20 years is 18.91 for January and 19.48 for February.
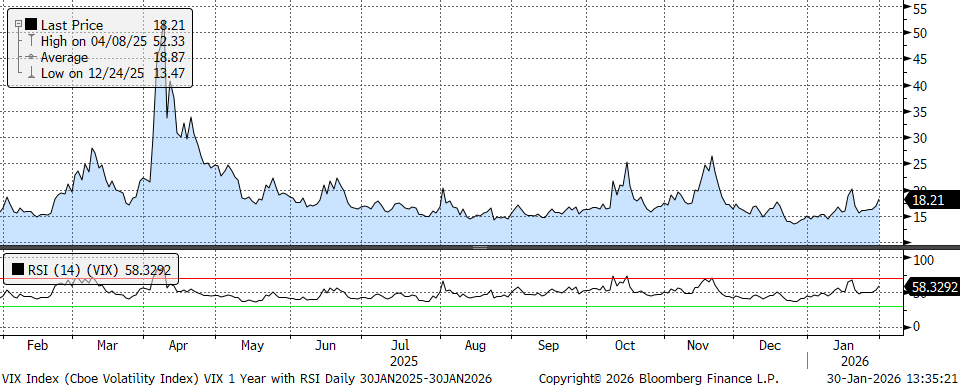
1-Year Trailing Chart of the VIX with RSI
1 Year Trailing level for the VIX with RSI. Currently 18.21 on 1/30/26, near 20 year averages for Jan. and Feb.
Sentiment & Technical Indicators
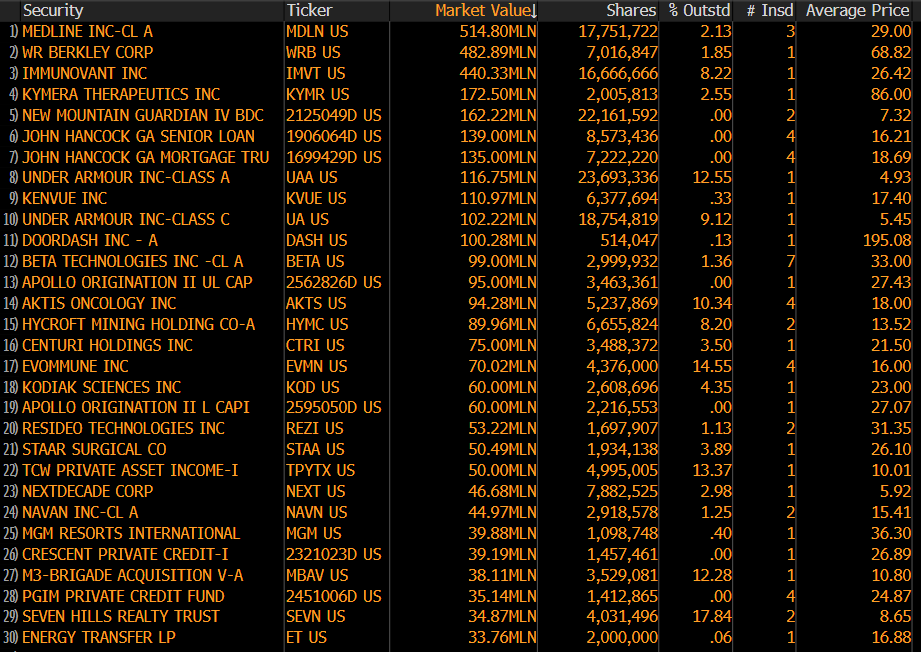
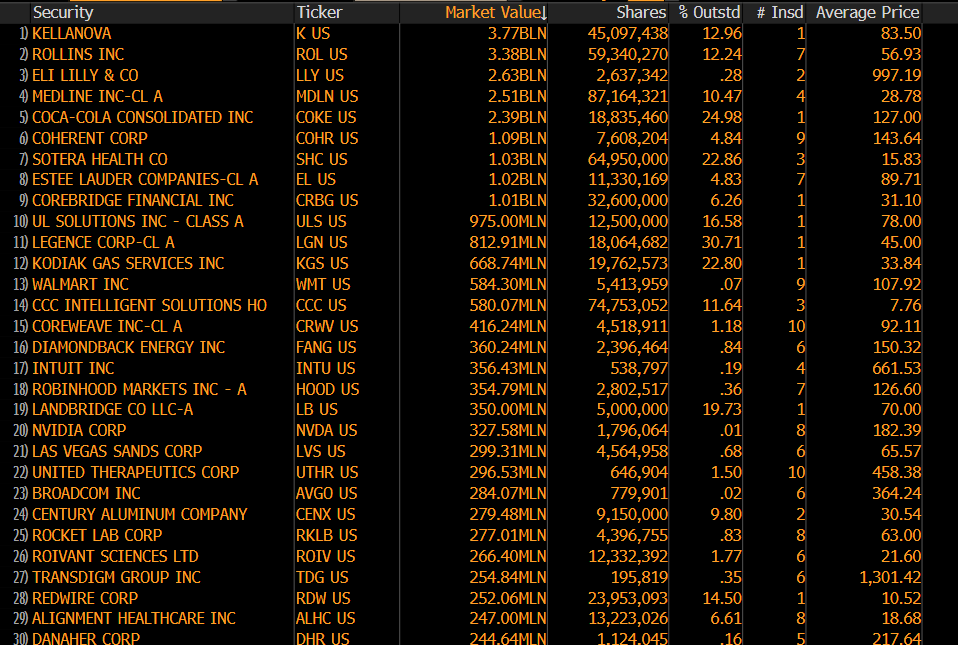
Insider Buying & Selling
Top Buys in the Last 3 Months (as of 1/30/26 via Bloomberg)
Top Sells in the Last 3 Months (as of 1/30/26 via Bloomberg)
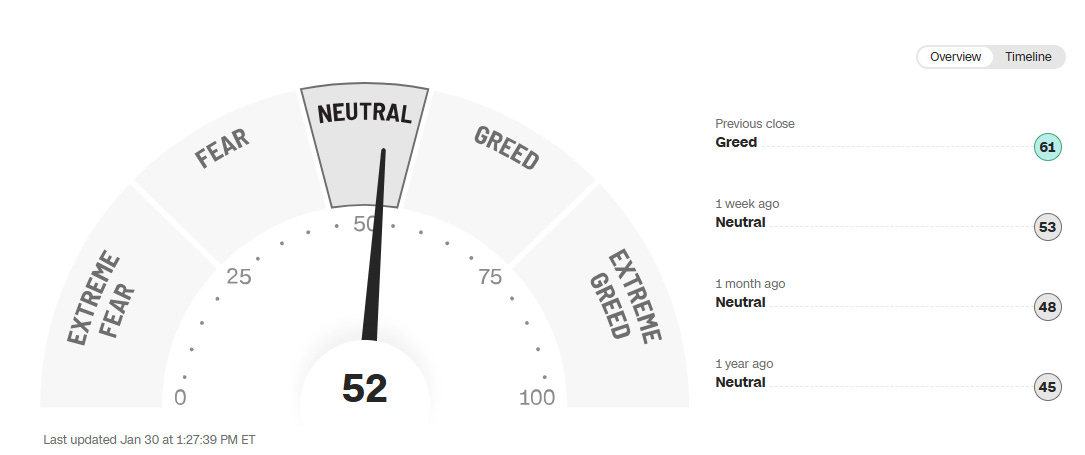
CNN Fear & Greed Indicator
CNN Fear & Greed Indicator as of 1/30/2026 - https://www.cnn.com/markets/fear-and-greed
That’s all for this edition - see you next month for more charts!
Notes:
We are pleased to share a monthly version of our internal Risk Dashboard with our clients and subscribers from the investing public at large. A few reminders:
The HVP Risk Dashboard is not an equity or credit research product and not a specific recommendation to make any investment decisions.
Data is generally presented here without comment.
HVP and affiliates may have positions in or against any securities referenced.
This is a chart heavy report. Clicking or tapping a chart will open it in a new window. While we all live on our phones, the best viewing will probably be on a larger screen such as your iPad, laptop, or desktop.
The Risk Dashboard is complimentary for HVP clients, institutional partners, and members of the investing public we hope decide to become clients!