February 2026 - Tech Investors Sell First & Wait for Answers
Investors Question AI & Software...Markets Broaden
Feb 27, 2026
In a well timed appearance for this month’s HVP Risk Dashboard, our Christopher P. Davis spoke pre-open this morning on Schwab Network. Rather than write out a recap of the month in markets and our thoughts as we enter the tail-end of Q1, you can watch it below!
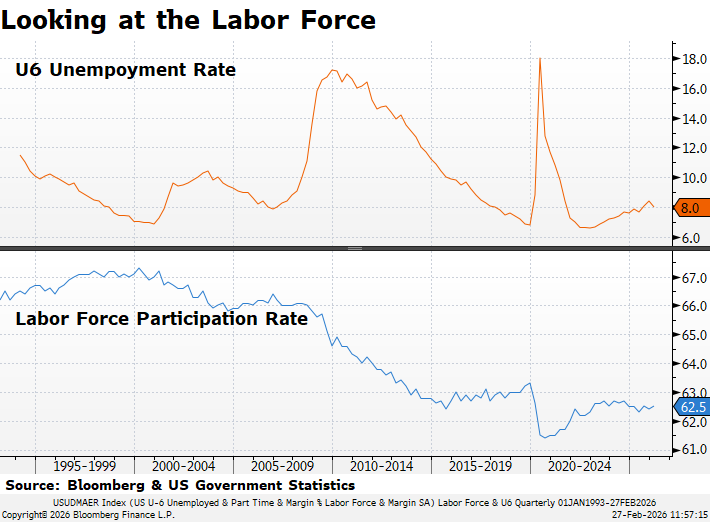
U6 is a wider measure of unemployment than the commonly cited headline number. Data most recently available via Bloomberg.
Tech Sector Layoffs:
2026: 29,570 employees / 45 companies
2025: 123,941 employees /269 companies
2024: 152,074 employees/546 companies
2023: 263,180 employees/1,191 companies
2022: 166,269 employees/1,064 companies
(layoffs.fyi as of 2/27/2026)
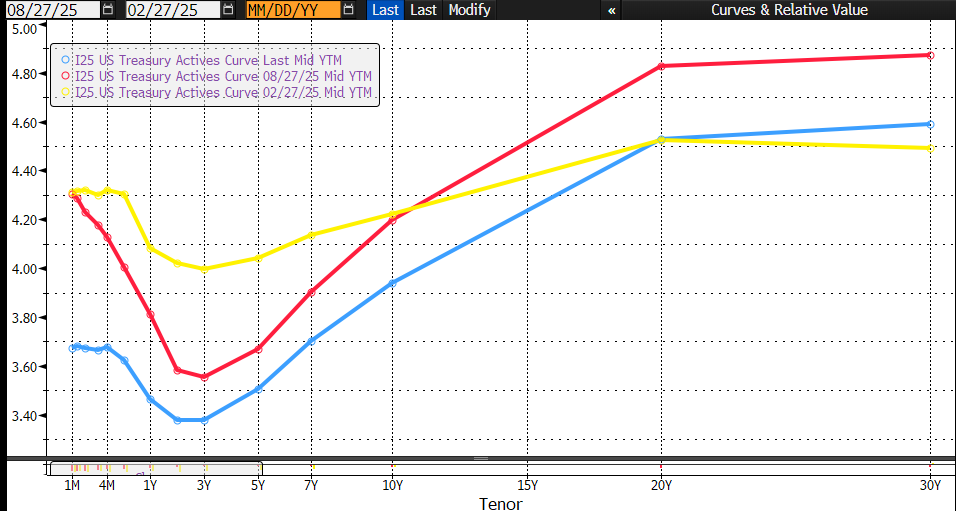
The Movement of the US Treasury Yield Curve
Blue = Current; Red = 6 months ago; Yellow =1 Year Ago
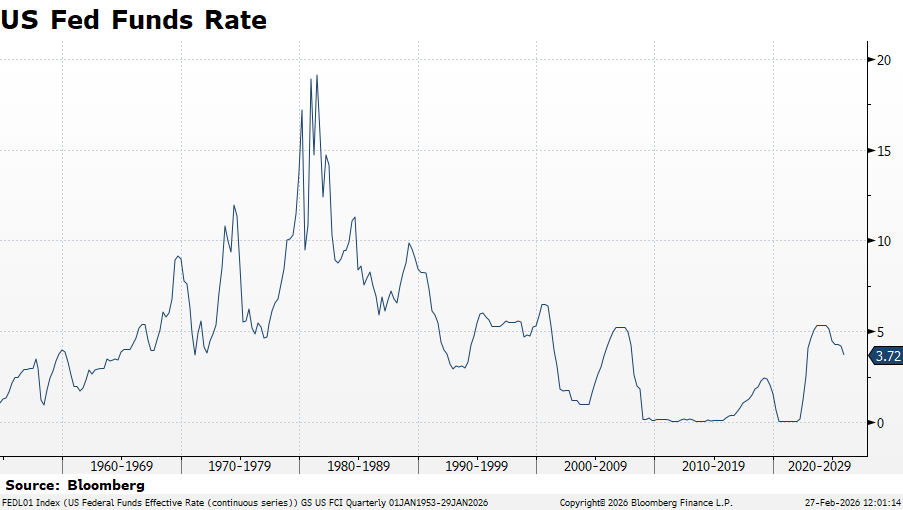
Fed Funds on a LONG time scale…1953 to present. Current rate 3.5-3.75% as of 2/27/26.
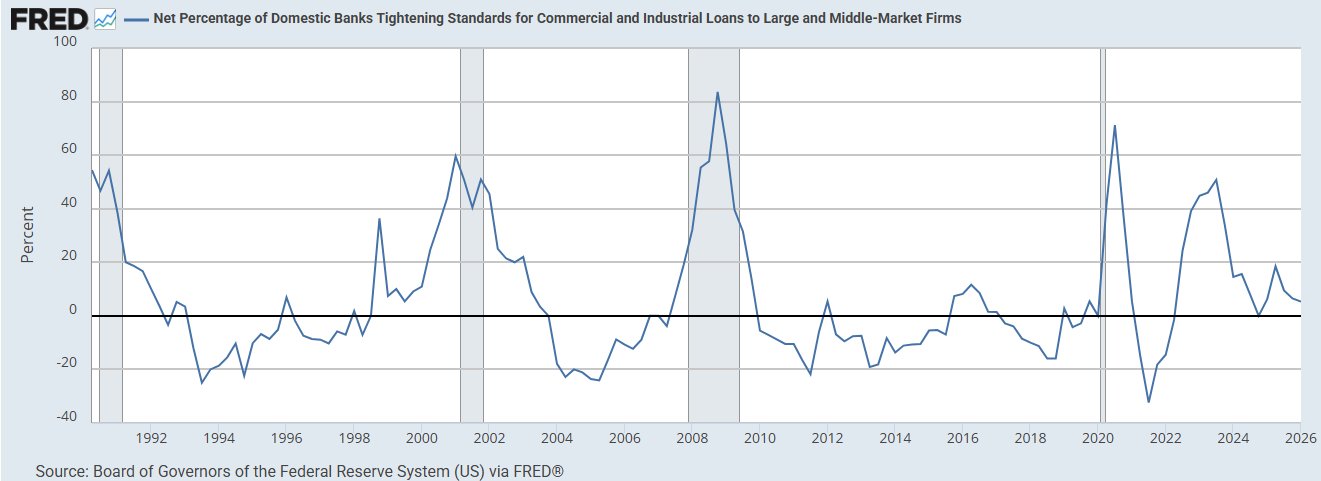
Net % of Banks Tightening Lending Standards for C&I Loans
As of 2/3/26 via FRED & St. Louis Federal Reserve Board
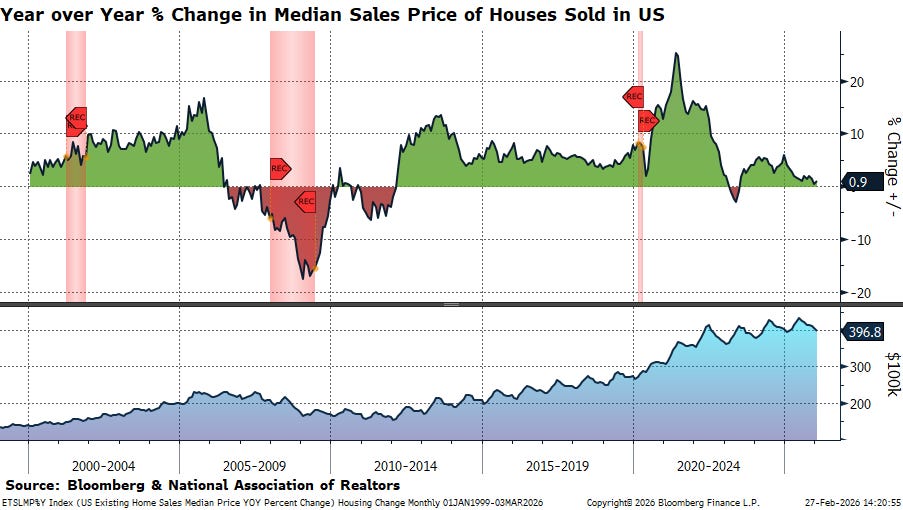
Looking at Housing
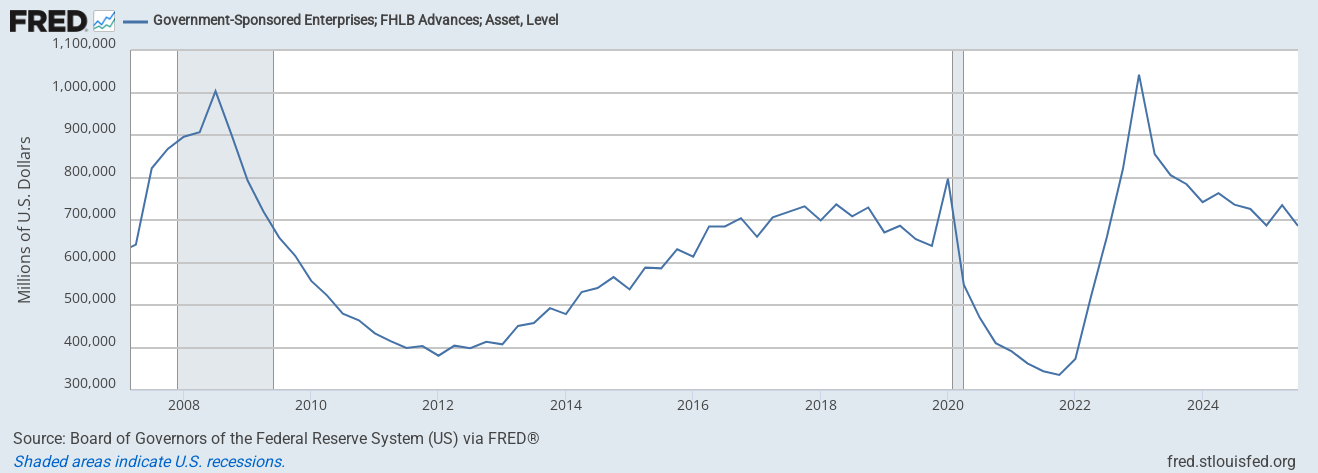
Canary in the Coal Mine: FHLB Borrowings
As of 1/9/26 via FRED & St. Louis Federal Reserve Board
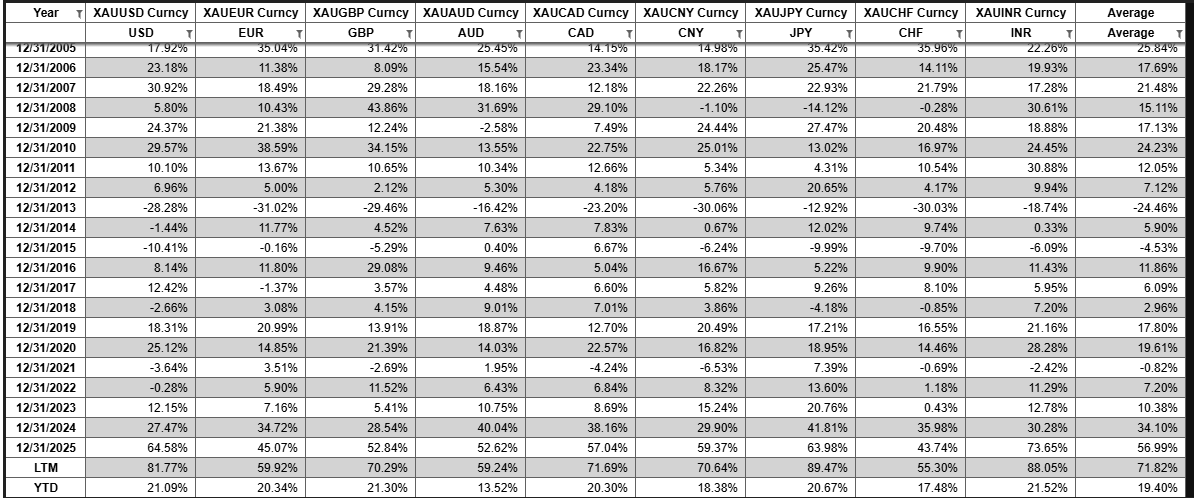
Performance of Gold in Major Currencies - % Change
Click to enlarge. As calculated by HVP Research. Raw data via Bloomberg as of 2/27/26.
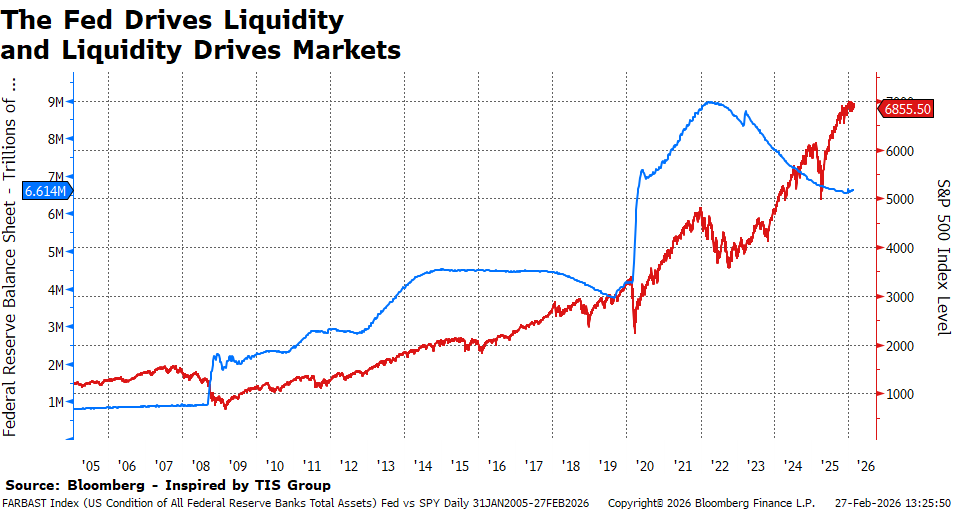
Broad Market Levels
Blue & Left Scale - Fed Balance Sheet in USD. Red & Right Scale S&P 500 Index level. Via Bloomberg as 2/27/2026.
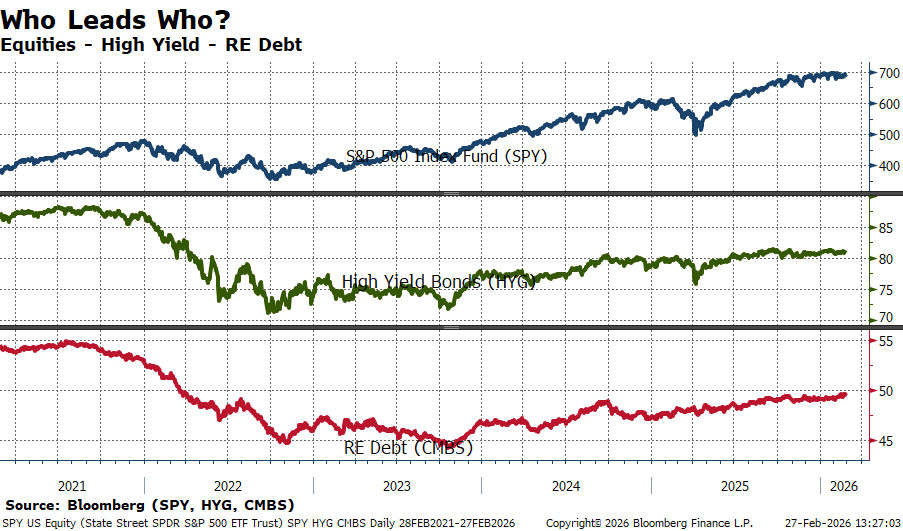
Top Panel/Blue = SPY; Middle Panel/Green = HYG; Bottom Panel/Red = CMBS. As of 2/27/2026.
Moving Averages
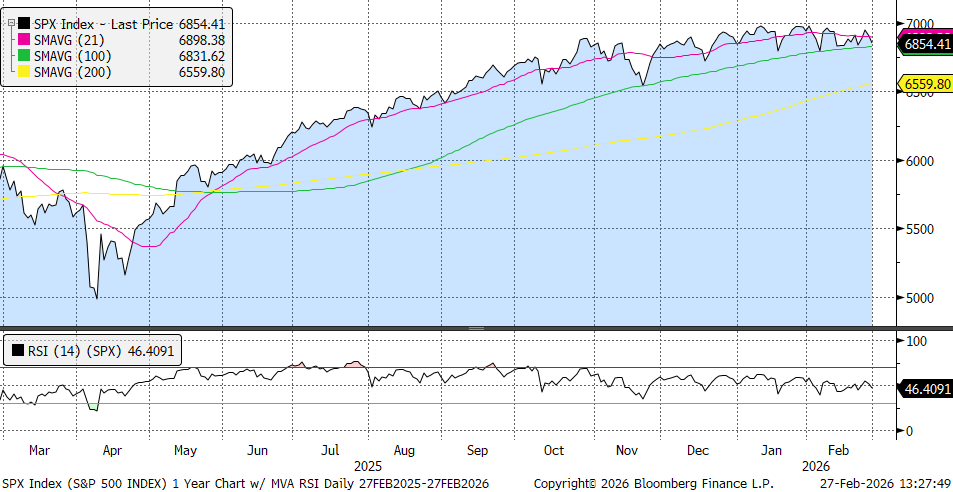
S&P 500
S&P 500 Index 1 Year trailing, with moving averages and RSI. Chart via Bloomberg as of 2/27/2026.
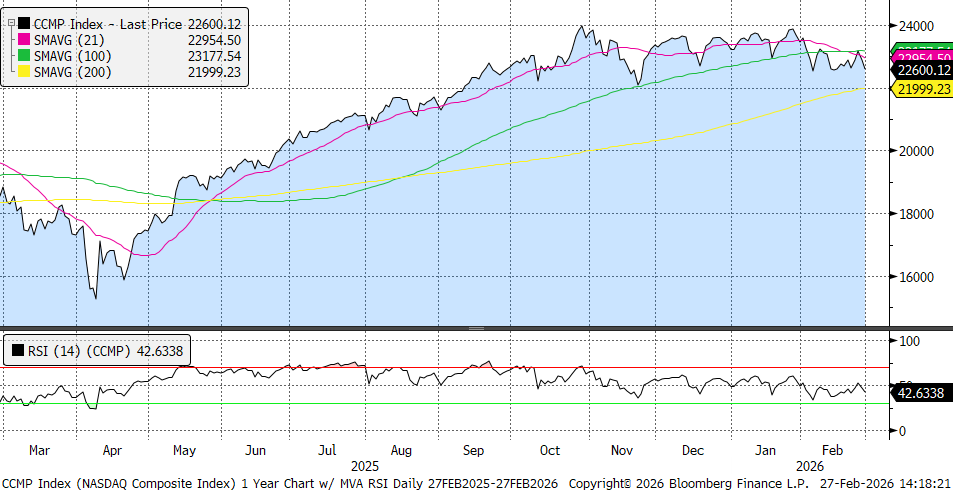
Nasdaq
NASDAQ Composite Index 1 Year trailing, with moving averages and RSI. Chart via Bloomberg as of 2/27/2026
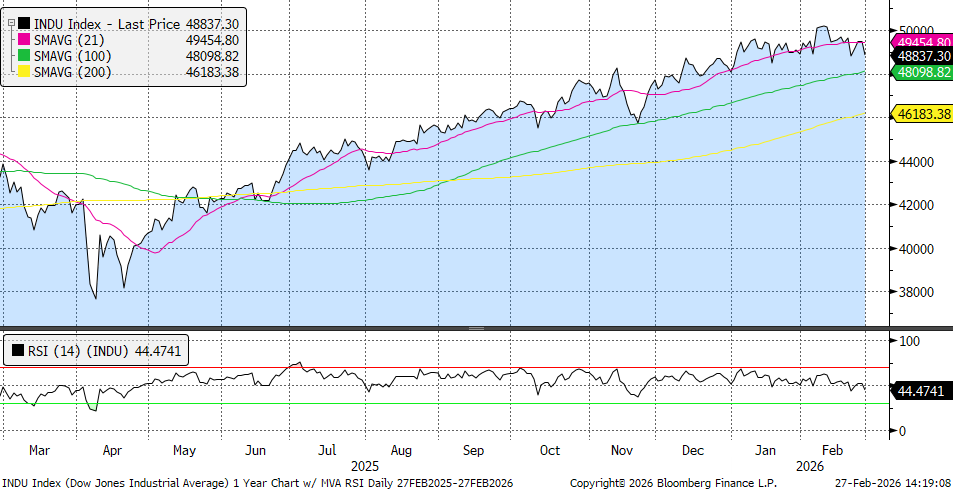
Dow Jones Industrial Average
Dow Jones Industrial Average 1 Year trailing, with moving averages and RSI. Chart via Bloomberg as of 2/27/2026
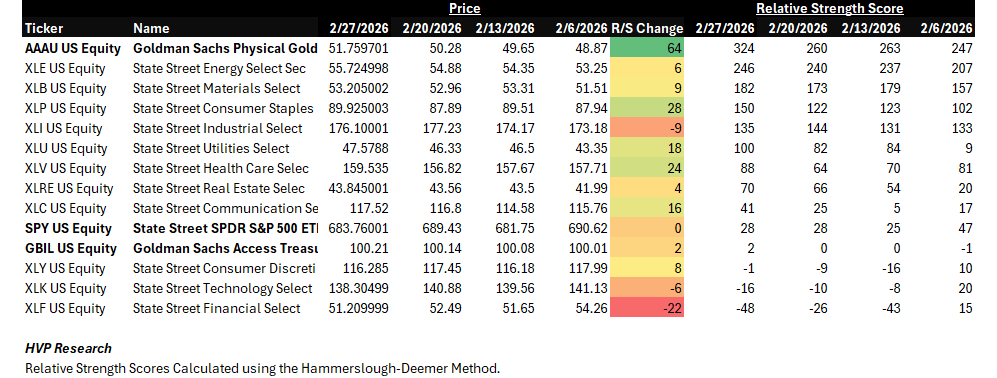
A Look at the S&P 500 Sectors:
As calculated by HVP Research. S&P 500, Gold, & T-Bills bolded as reference levels. Data as of 2/27/26.
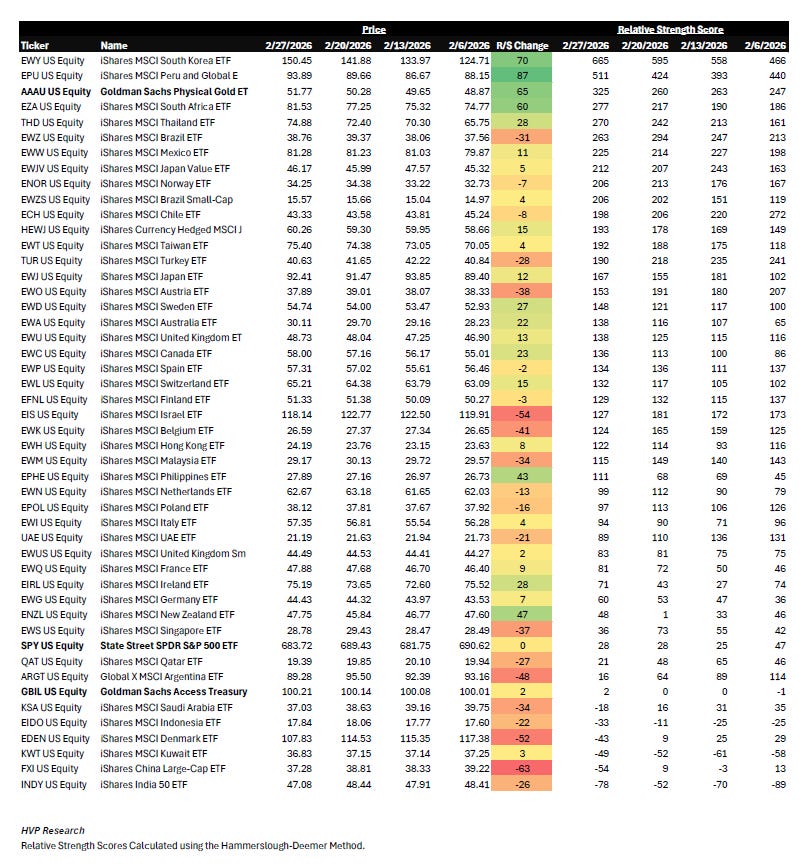
A look around the (multipolar) world:
As calculated by HVP Research. S&P 500, Gold, & T-Bills bolded as reference levels. Data as of 2/27/2026
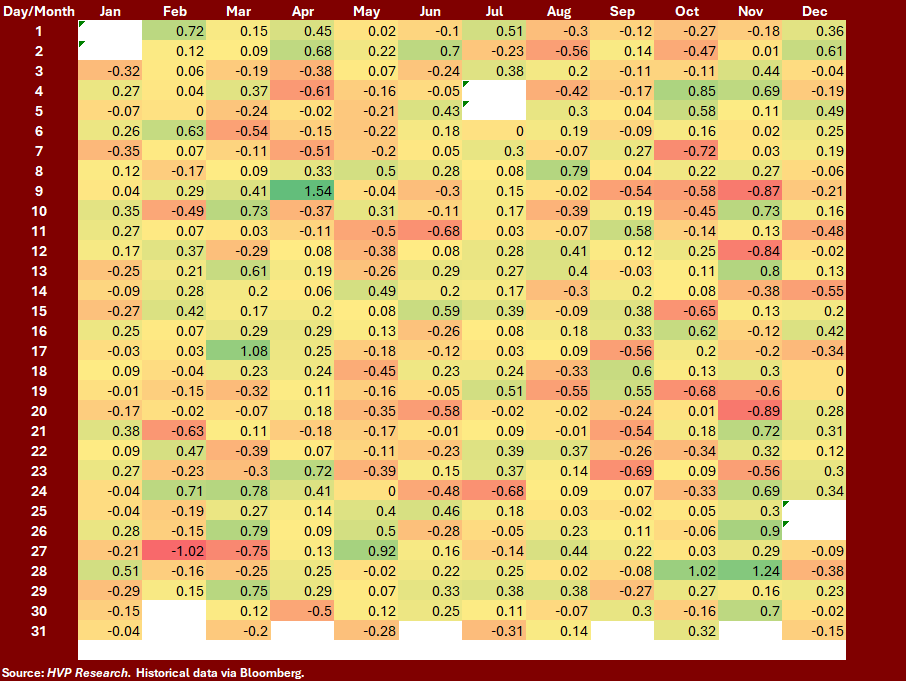
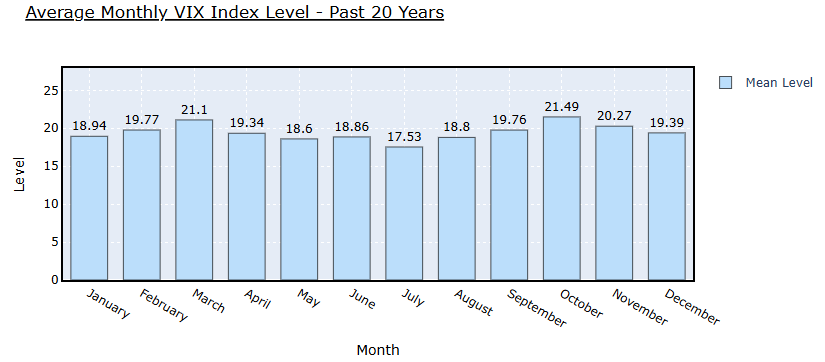
Seasonality
Average Daily S&P 500 Index Returns over the Past 20 Years:
Hudson Value Principle: Be cognizant of seasonality, but not a slave to it. Data as of 2/27/2026 via Bloomberg as calculated by HVP Research.
As calculated by HVP Research, the average monthly VIX Level over the past 20 years 21.1 for March.
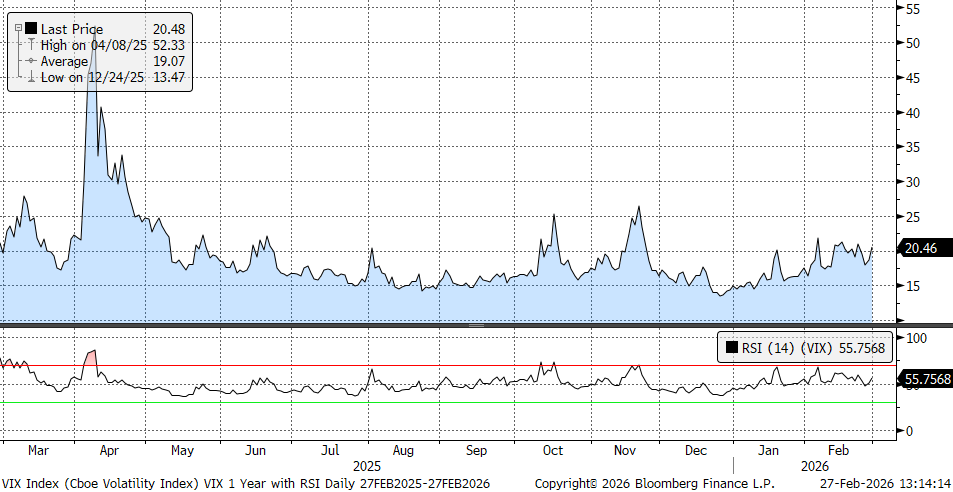
1-Year Trailing Chart of the VIX with RSI
1 Year Trailing level for the VIX with RSI. Currently 20.48 on 2/27/26.
Sentiment & Technical Indicators
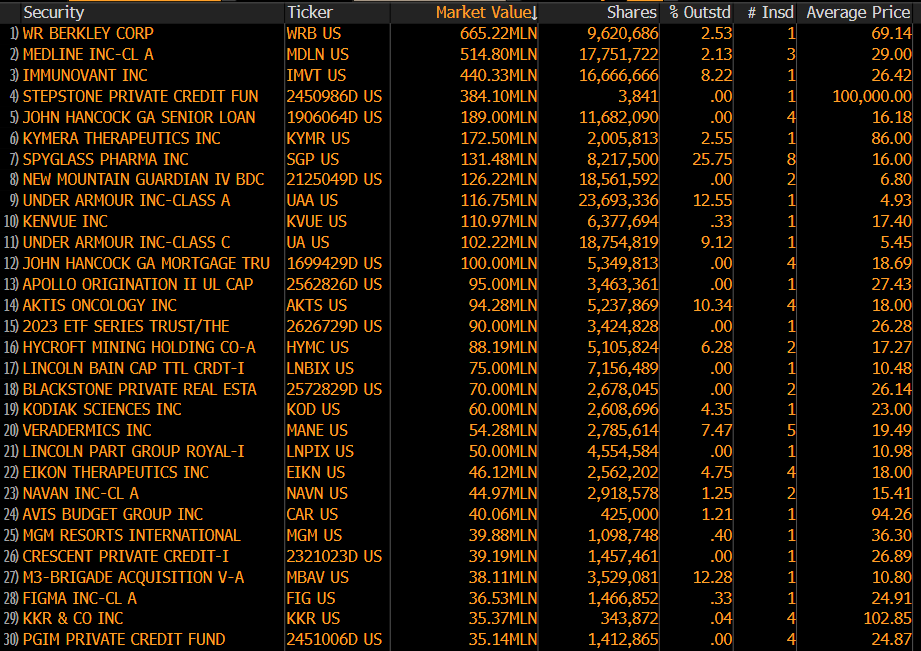
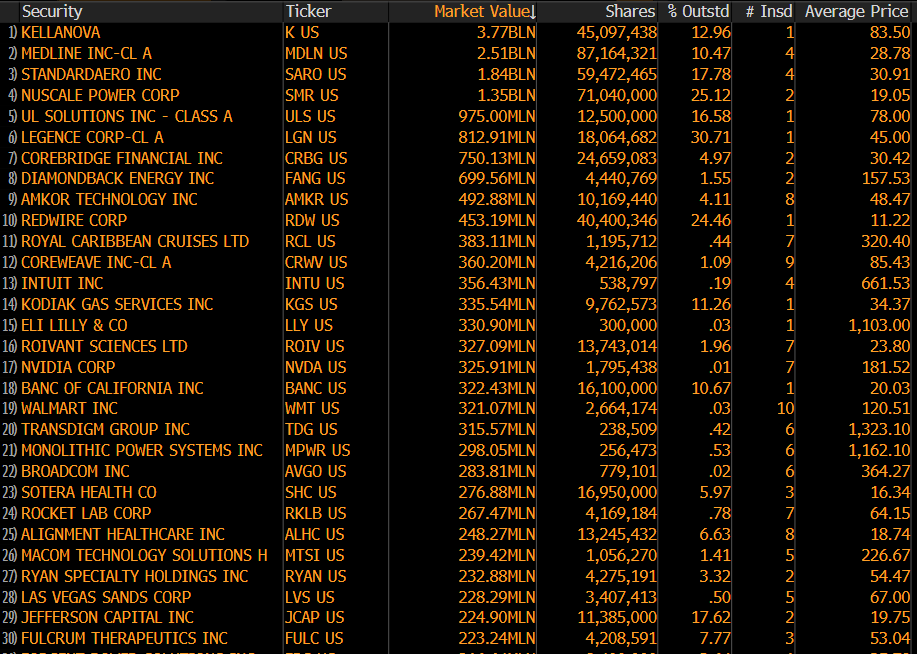
Insider Buying & Selling
Top Buys in the Last 3 Months (as of 2/27/26 via Bloomberg)
Top Sells in the Last 3 Months (as of 2/27/26 via Bloomberg)
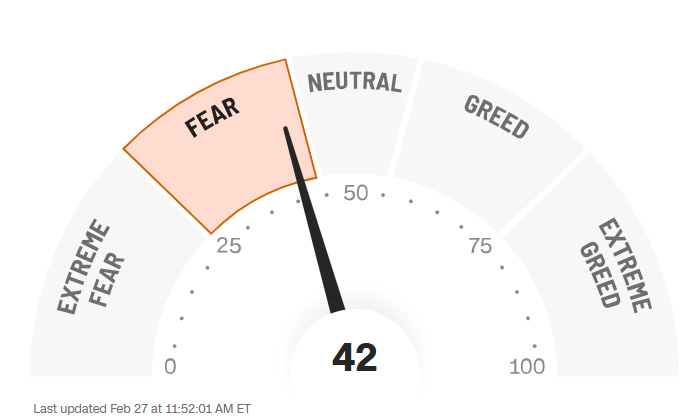
CNN Fear & Greed Indicator
CNN Fear & Greed Indicator as of 2/26/26 via https://www.cnn.com/markets/fear-and-greed
That’s all for this edition - see you next month for more charts!
Notes:
We are pleased to share a monthly version of our internal Risk Dashboard with our clients and subscribers from the investing public at large. A few reminders:
The HVP Risk Dashboard is not an equity or credit research product and not a specific recommendation to make any investment decisions.
Data is generally presented here without comment.
HVP and affiliates may have positions in or against any securities referenced.
This is a chart heavy report. Clicking or tapping a chart will open it in a new window. While we all live on our phones, the best viewing will probably be on a larger screen such as your iPad, laptop, or desktop.
The Risk Dashboard is complimentary for HVP clients, institutional partners, and members of the investing public we hope decide to become clients!