Where do we start? Hard-power? Summits? Soft-power? Central Banks? Or a US earnings season for the second quarter that has so far posted an aggregate beat by 7.4% (as per data compiled by Bloomberg)? Despite the chaos of April and the recoveries of May and June, the business of business has seemingly gone on uninterrupted. That has been good news for investors. Lately we have been finding ourselves relying on alternative data and some newer sources to help build our mosaic. Traditional gauges such as the University of Michigan Consumer sentiment index show declines on a YTD basis, but when we evaluate at the company level, we can see more robust patterns when looking at credit card spending data. It might be a uniquely American response - “Yes I’m nervous about the economy, but no, I’m not going to stop spending!” Just like with policy makers that are long on rhetoric we try our best to weight what people do more than what they say.
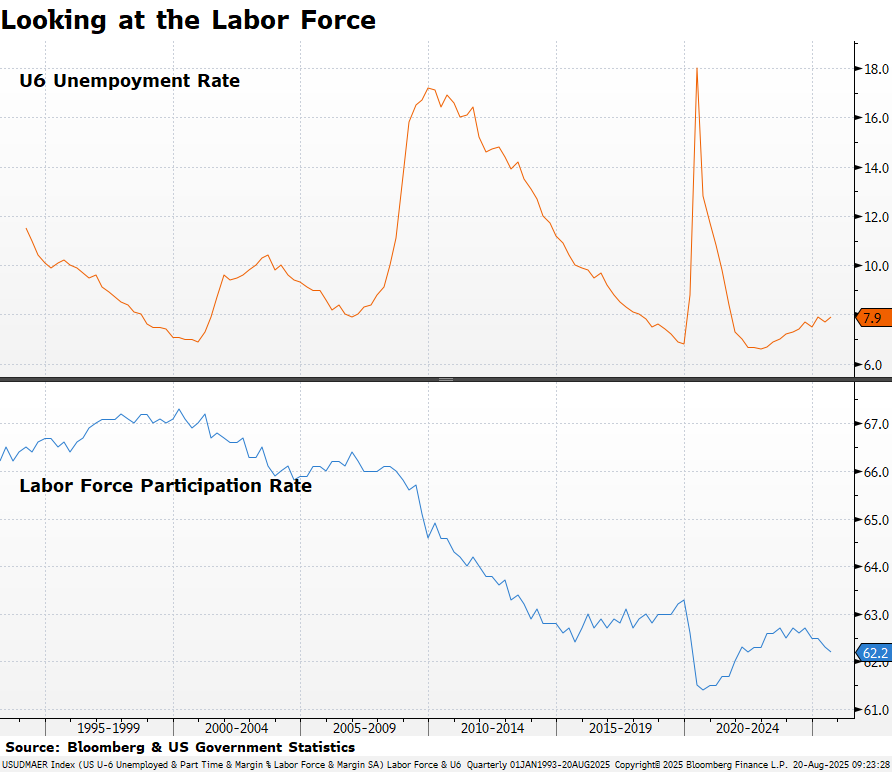
Where the numbers are less contradictory however are within the labor market. The headline unemployment rate has bounced around in a tight range of 4-4.2% for the past 12 months - certainly a strong level. Labor force participation has declined about 0.50% in the past 12 months. Not exactly what you would hope for in a growing economy, but we also are less convinced that the BLS is accurate to the level of 0.10%. That’s not a sleight against them, but a recognition of how hard is to measure an economy as large, diverse, and regional as the US. We prefer to think about the direction or trend rather than get too excited or depressed by tenths of a percent. Where it does get murkier is when we look under the hood at job gains/losses at a sector level. Depending on how you slice the data, roughly half of sectors or industry groups are adding jobs and half contracting. That’s a knife edge we want to watch. And to evaluate the reasons for those changes…pandemic over-hires rolling off? AI & technology increasing productivity? Or firms cutting costs due to declining sales? Each of those scenarios has different investment implications. It will be an area we watch closely.
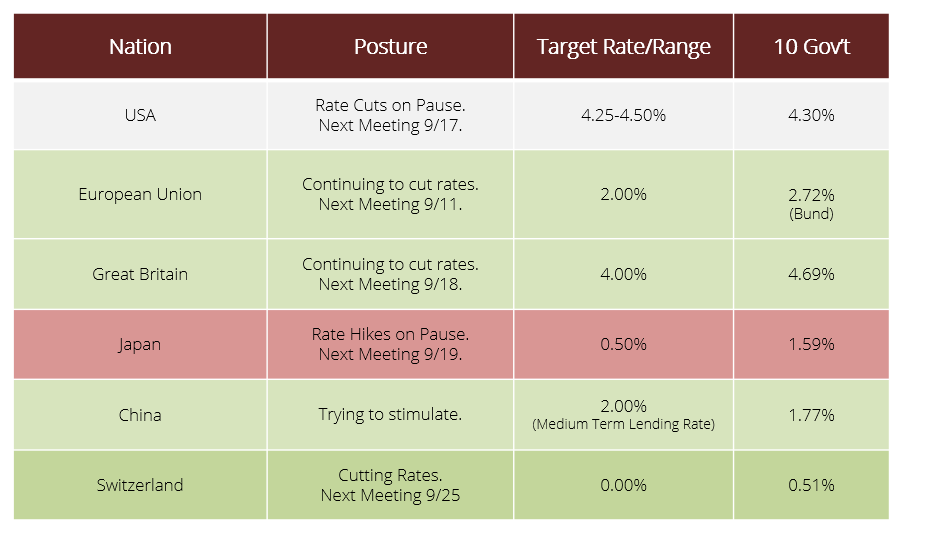
All eyes will be on the Grand Tetons later this week for the Kansas City Federal Reserve’s Jackson Hole monetary policy symposium. We’ll get a speech from Federal Reserve Chair Jerome Powell and some new tea leaves about the upcoming FOMC meeting in September. Fed Funds futures are pricing in an 84% chance of a rate cut on September 17th as we write this (WIRP function via BBG). That, however, could change dramatically by the end of the week.
In markets unprofitable, speculative, and momentum driven companies which had a very hard bounce from May-July appear to be taking a breather as investors regain their focus on earnings and profitability. While these aren’t areas of the market we traffic in at Hudson Value Partners, they certainly can create a lot of chop on the surface. As we look to the fall, the headline driven market environment is here to stay.
In the press, journalists looked to HVP for some comments on recent events at Berkshire-Hathaway. We offered thoughts on their recent investment in the healthcare sector in a Bloomberg News article, and a theory on investor flows for CNBC’s Buffett Watch Newsletter.
Yesterday, in between some meetings in NYC, HVP’s Christopher Davis stopped by Bloomberg HQ on 731 Lexington Ave to join BNN Bloomberg’s “The Close” where he shared our thoughts on earnings, the consumer, and made our case for owning consumer stocks on both ends of the economy, namely McDonald’s (MCD) and luxury firm Richemont (CFRUY). You may find details on the video appearance here.
BNN Bloomberg “The Close” August 19, 2025
Themes to Takeaway
Bullish Themes
It’s been a strong earnings season - many companies have posted 2 great quarters for 2025 - the year is half in the bag.
Capital Markets activity within IPOs as well as Mergers & Acquisitions continue at a healthy pace.
Companies have shown little inclination to pull back on investment in the face of tariff uncertainty - they seem to be learning to live with them, although Q3 earnings will be a bigger test.
Bearish Themes
Speculative assets are starting to rollover - that can sometimes be the first “tell” that the market is running out of steam.
Tariffs were the end of the world in early April. Similar tariff rates in July & August are being treated as a non-event by investors. What changed?
Geopolitical optimism can very quickly turn to despair.
Keep your eye on
Real applications of AI in your personal and professional lives. Tell us what works!
Watch the labor market closely - that may compel Fed action sooner than a further decline in inflation emerges.
Stablecoins. We might just see in the next 12 months how much is hype and how much is innovation.
The U6 Unemployment rate is a broader measure than the commonly sited U3 headline number.
Alternative Looks at the Labor Force:
U6 Unemployment calculated in the pre-1994 adjustment method:
27.80%
(John Williams’ Shadow Government Statistics July 2025)
Tech Sector Layoffs:
2025: 81,567 employees /186 companies
2024: 152,074 employees/546 companies
2023: 263,180 employees/1,191 companies
2022: 166,269 employees/1,064 companies
Federal Sector Departures & “DOGE” Cuts:
Total YTD Federal Departures: 178,296
…of which DOGE Layoffs are: 67,749
(layoffs.fyi as of 8/20/2025)
Global Central Bank Postures
Going to be a busy September! Data as of 8/20/25 via Bloomberg
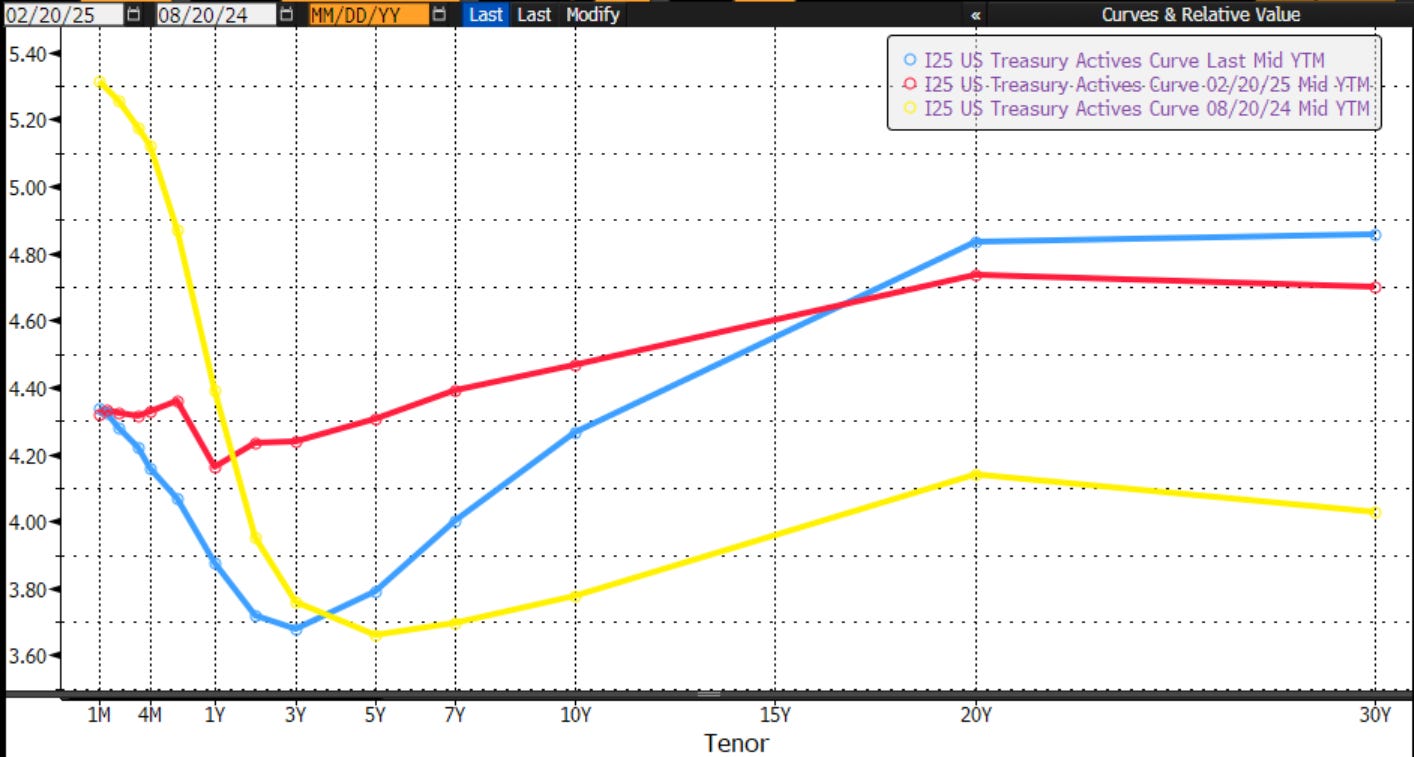
The Movement of the US Treasury Yield Curve
Blue = Current; Red = 6 months ago; Yellow =1 Year Ago
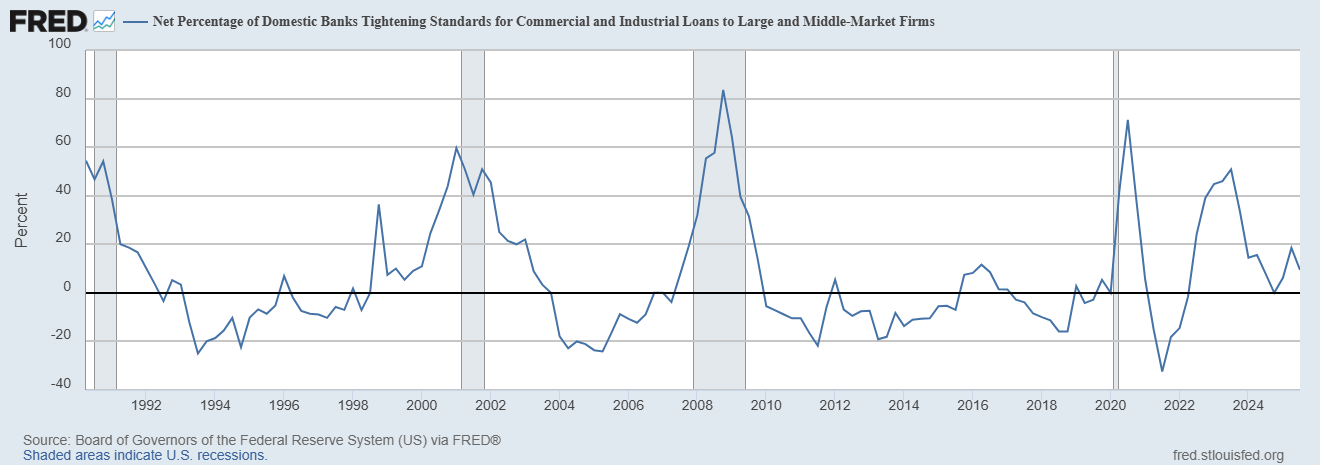
Net % of Banks Tightening Lending Standards for C&I Loans
As of 8/4/25 via FRED. A moderation after the prior reading’s shift higher.
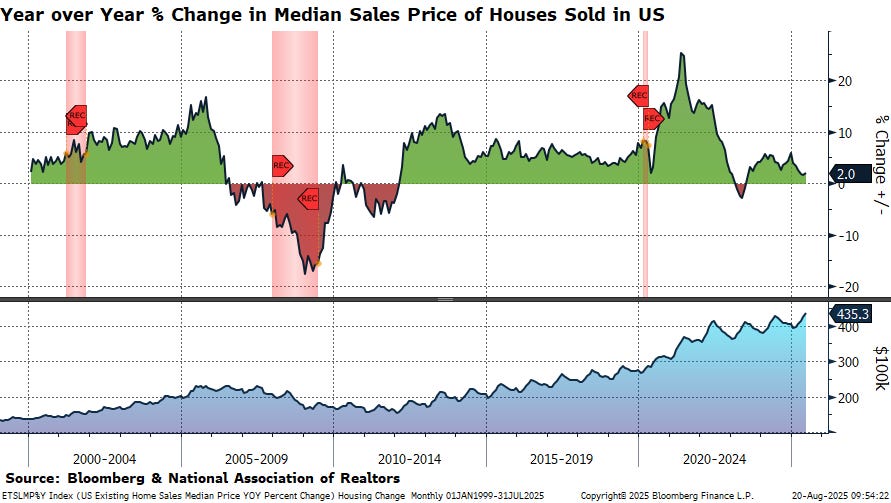
Looking at Housing
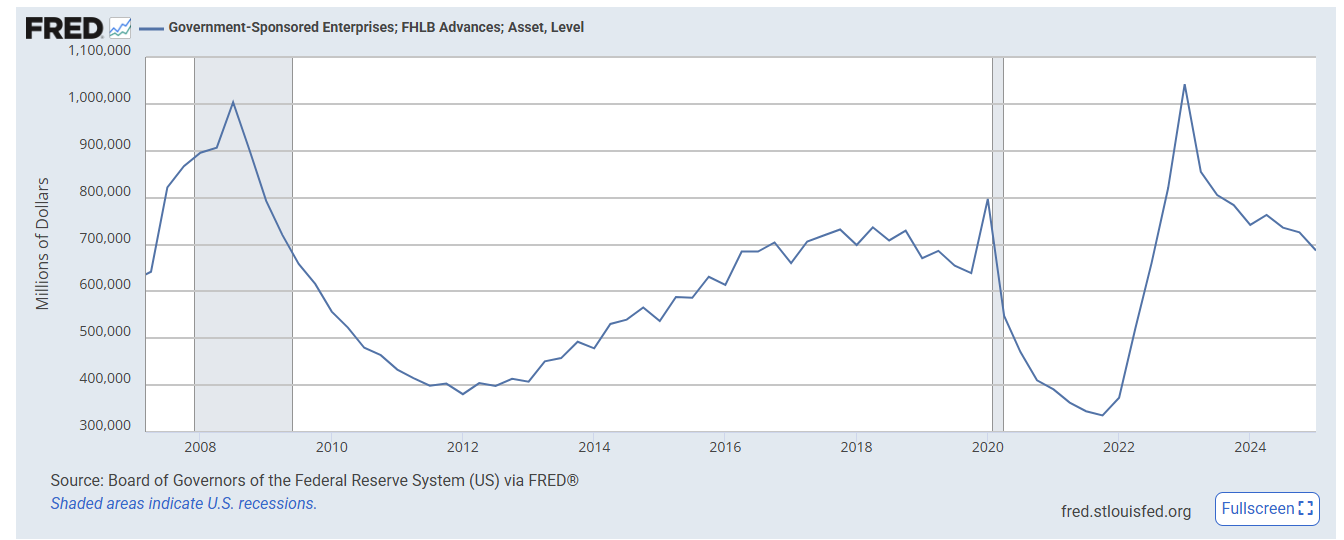
Canary in the Coal Mine: FHLB Borrowings
Via FRED. As of June 12, 2025. Shaded periods indicate recessions.
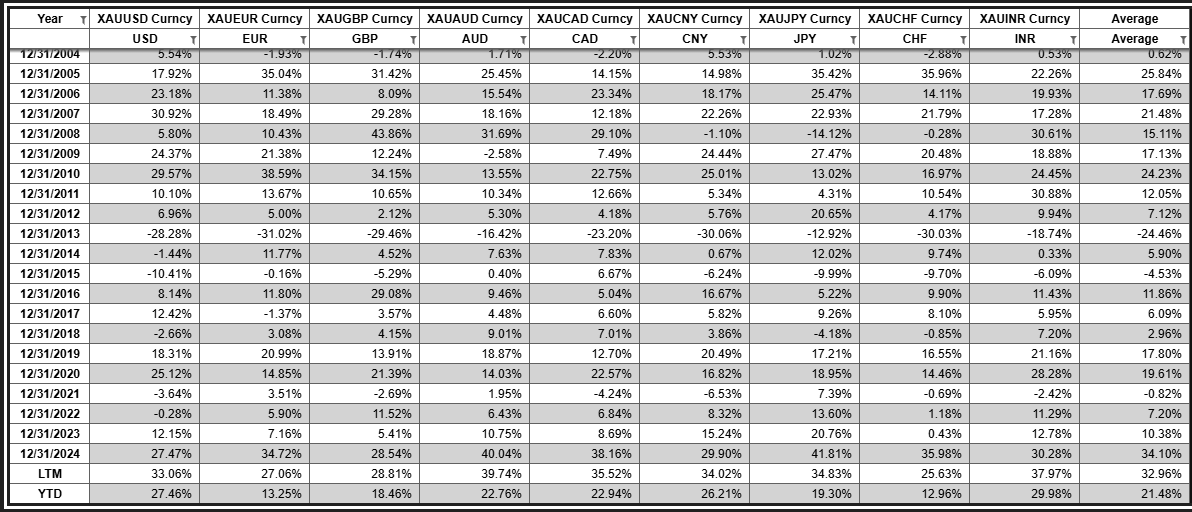
Performance of Gold in Major Currencies - % Change
Click to enlarge. As calculated by HVP Research. Raw data via Bloomberg as of 8/20/25. Barbarous relic or low cost absolute return alternative?
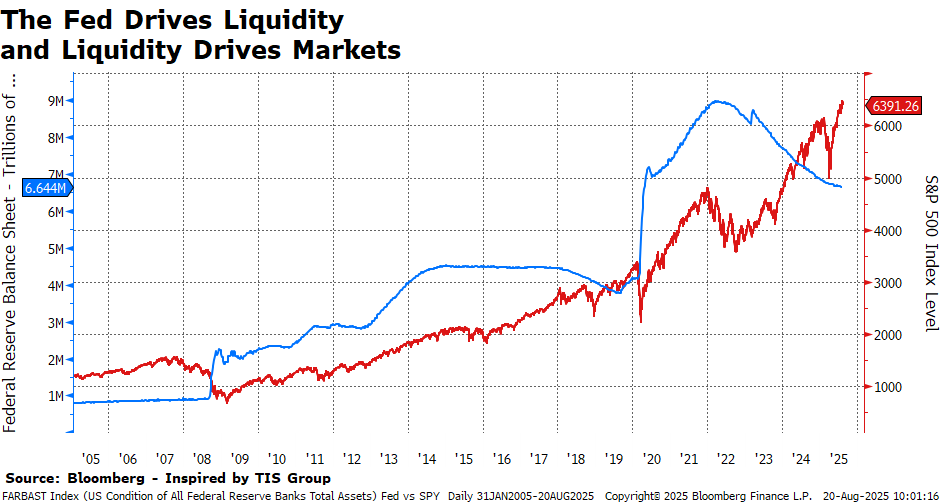
Broad Market Levels
Blue & Left Scale - Fed Balance Sheet in USD. Red & Right Scale S&P 500 Index level. Via Bloomberg as 8/20/25.
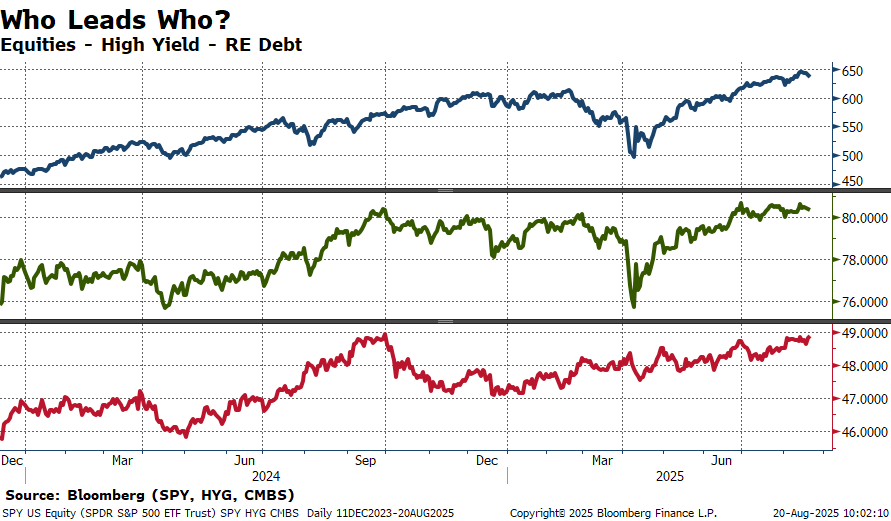
Top Panel/Blue = SPY; Middle Panel/Green = HYG; Bottom Panel/Red = CMBS. As of close on 8/20/2025.
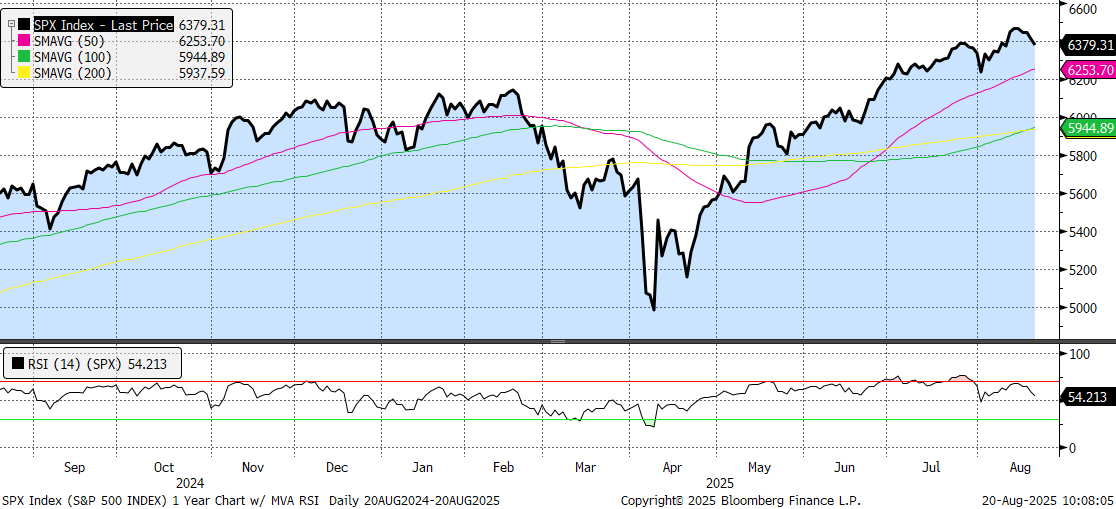
Moving Averages
S&P 500
S&P 500 Index 1 Year trailing, with moving averages and RSI. Chart via Bloomberg as of 8/20/2025
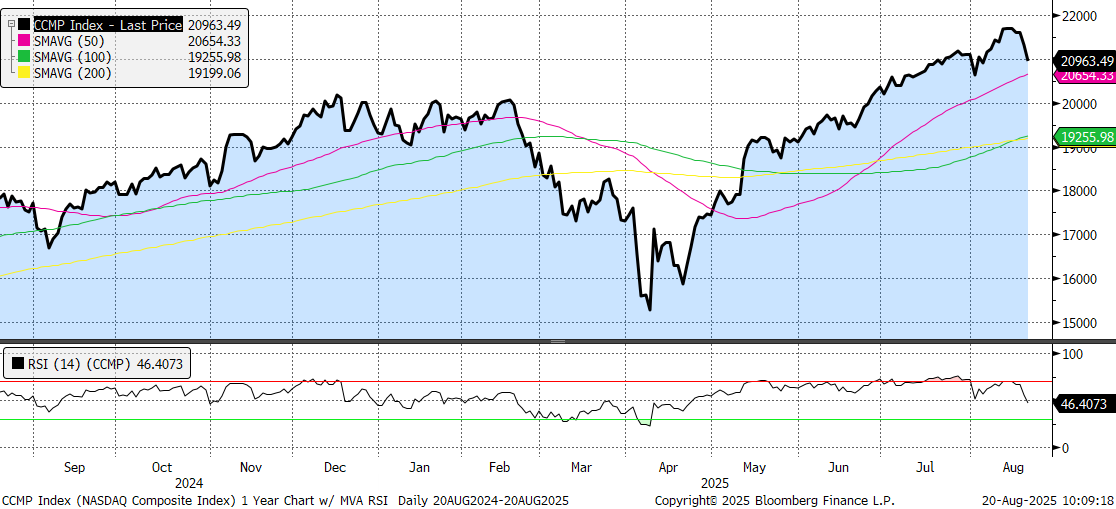
Nasdaq
NASDAQ Composite Index 1 Year Trailing, with moving averages and RSI. Chart via Bloomberg as of 8/20/2025.
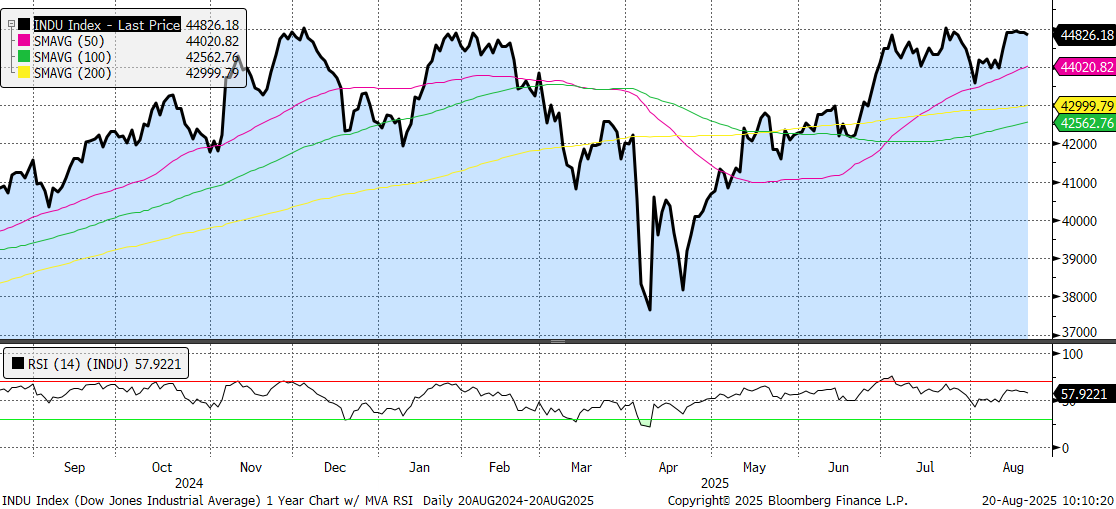
Dow Jones Industrial Average
Dow Jones Industrial Average 1 Year Trailing, with moving averages and RSI. Chart via Bloomberg as of 8/20/2025.
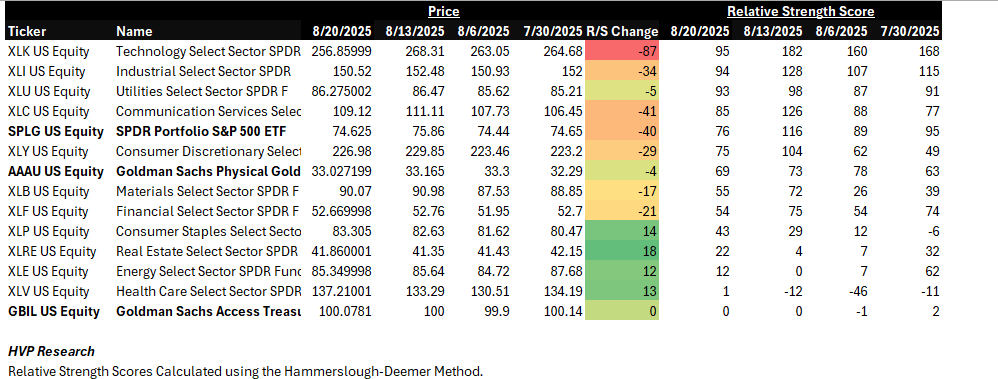
A Look at the S&P 500 Sectors:
As calculated by HVP Research. S&P 500, Gold, & T-Bills bolded as reference levels. Data as of 8/20/2025.
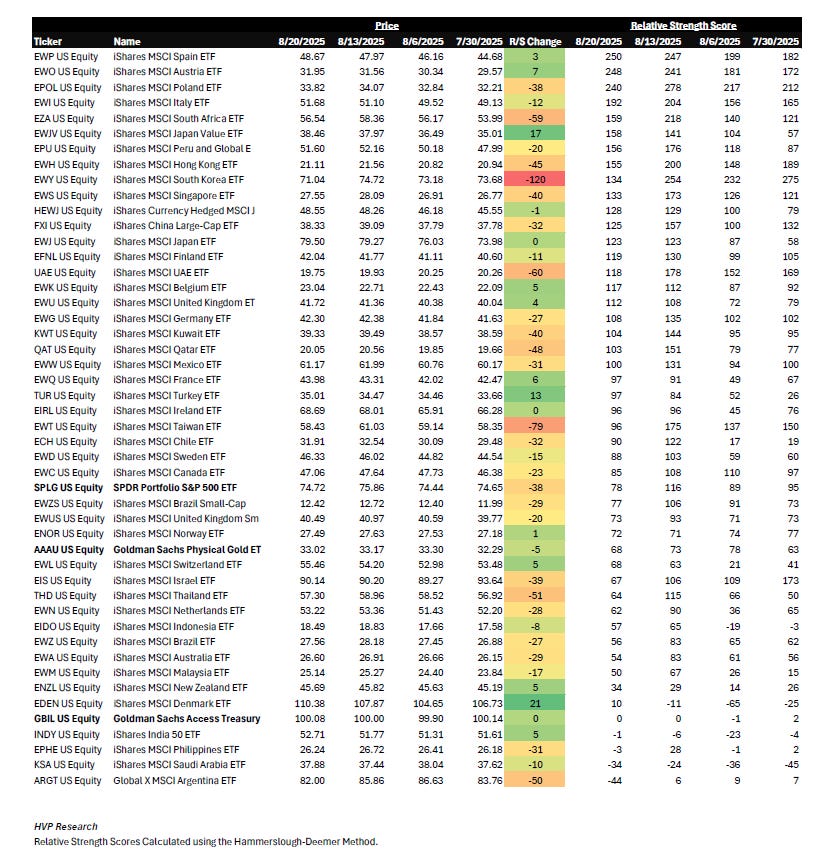
A look around the (multipolar) world:
As calculated by HVP Research. S&P 500 ETF, Gold, and T-Bills bolded as reference levels. As of 8/20/25.
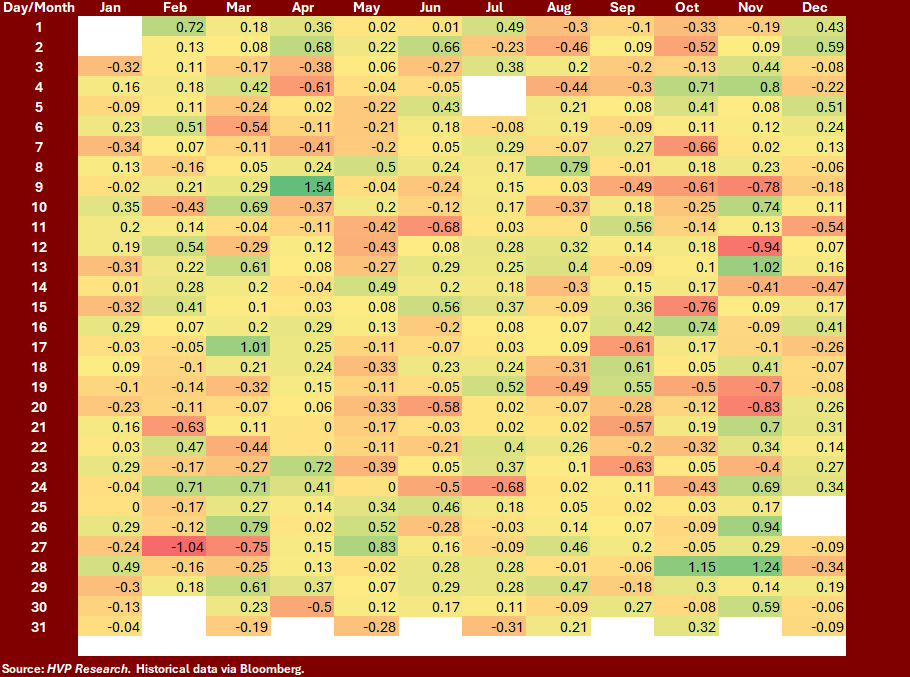
Seasonality
Average Daily S&P 500 Index Returns over the Past 20 Years:
Hudson Value Principle: Be cognizant of seasonality, but not a slave to it. Data as of 8/20/2025.
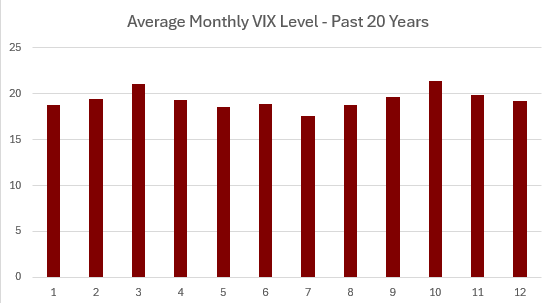
As calculated by HVP Research the average monthly VIX level for August in the past 20 years is 18.76 and 19.61 in September. Historical Data via Bloomberg as of 8/20/2025.
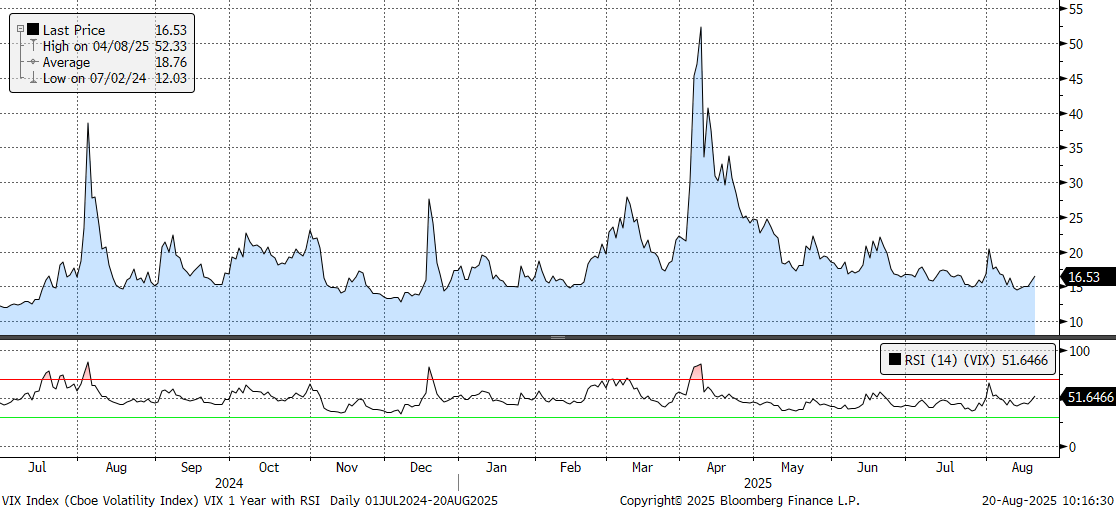
1-Year Trailing Chart of the VIX with RSI
Via Bloomberg as of the morning of 8/20/25 - VIX currently at 16.53, below 20 year averages for August & September.
Sentiment & Technical Indicators
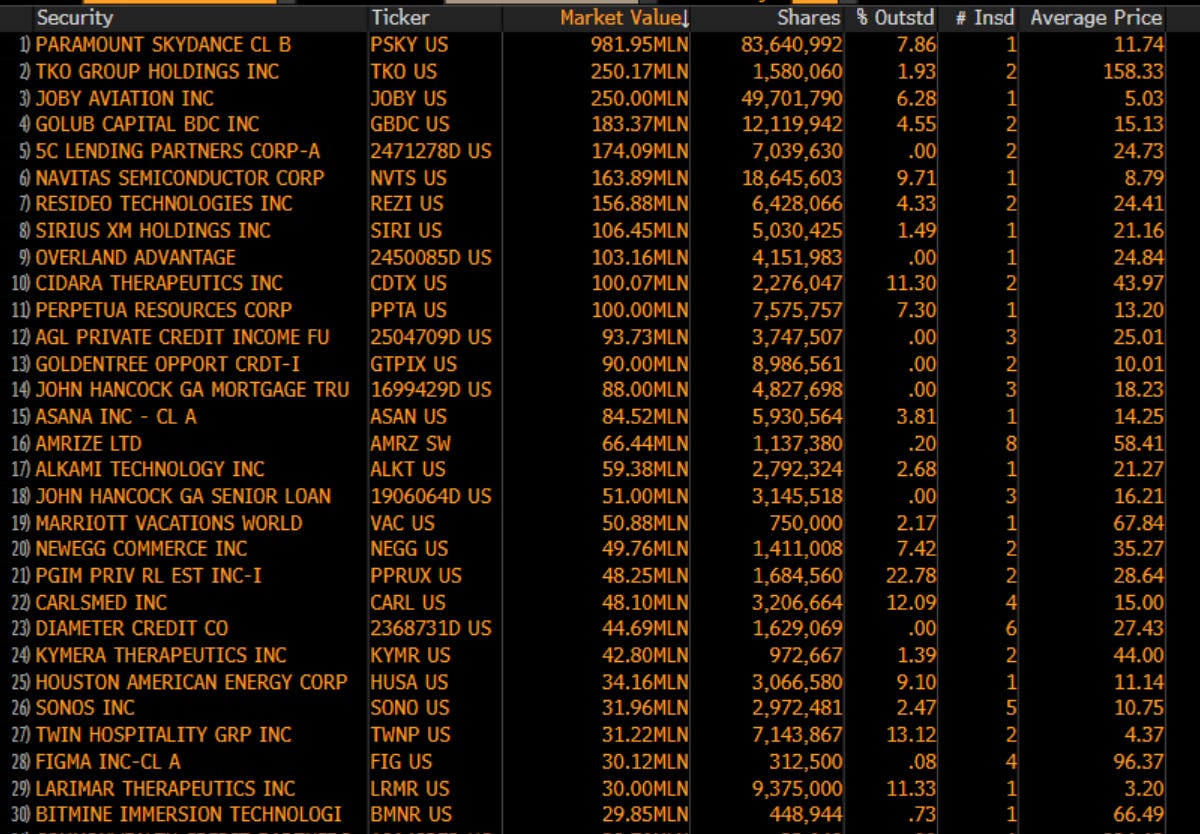
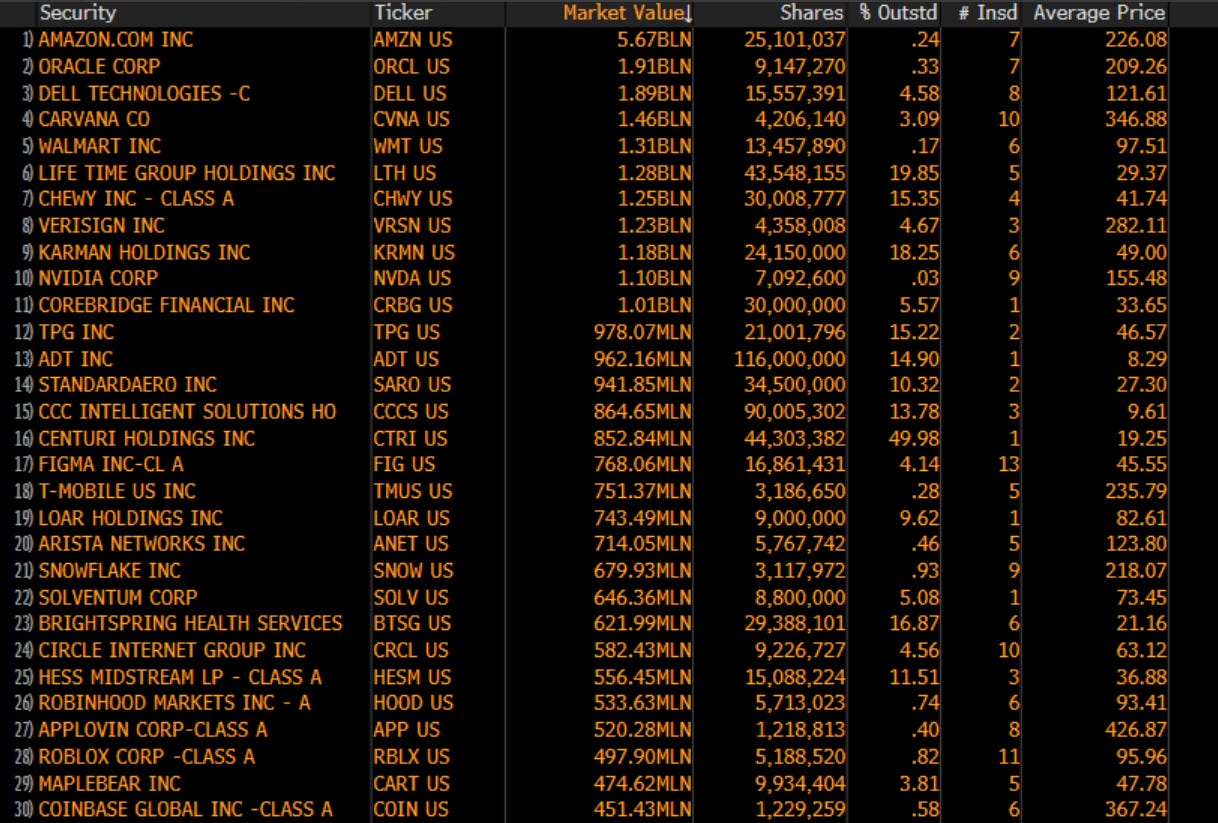
Insider Buying & Selling
Top Buys in the Last 3 Months (as of 08/20/25 via Bloomberg)
Top Sells in the Last 3 Months (as of 08/20/25 via Bloomberg)
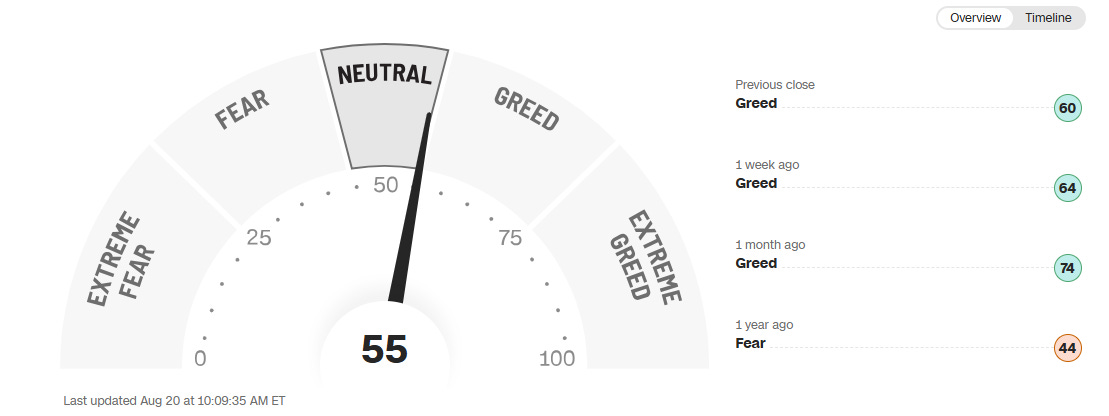
CNN Fear & Greed Indicator
Via CNN as of 8/20/25. Things can turn quickly!
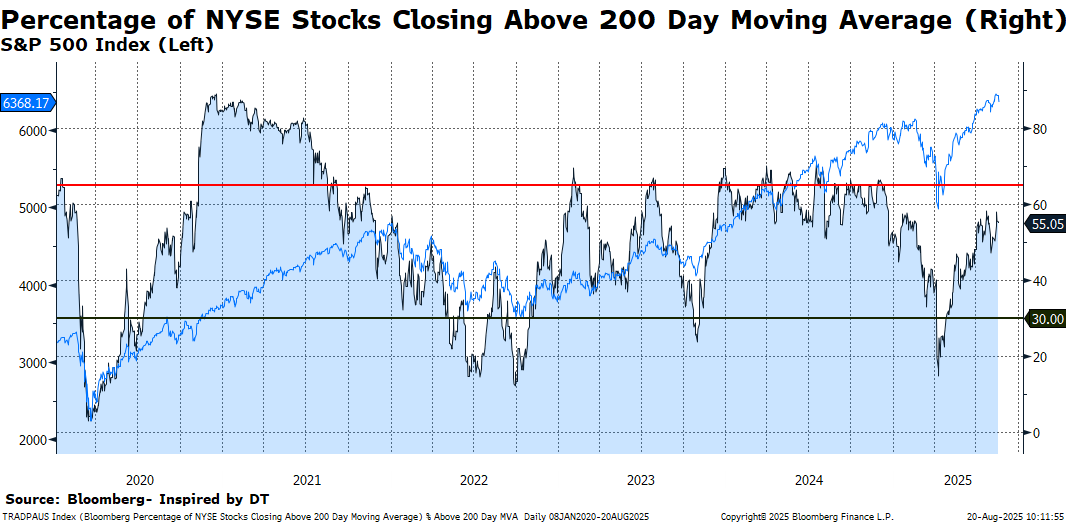
Click to enlarge. Chart via Bloomberg as of 8/20/25.
That’s all for this edition - see you next month for more charts!
Audio companion still in the works!
Notes:
We are pleased to share a monthly version of our internal Risk Dashboard with our clients and subscribers from the investing public at large. A few reminders:
The HVP Risk Dashboard is not an equity or credit research product and not a specific recommendation to make any investment decisions.
Data is generally presented here without comment.
HVP and affiliates may have positions in or against any securities referenced.
This is a chart heavy report. Clicking or tapping a chart will open it in a new window. While we all live on our phones, the best viewing will probably be on a larger screen such as your iPad, laptop, or desktop.
The Risk Dashboard is complimentary for HVP clients, institutional partners, and members of the investing public we hope decide to become clients!